


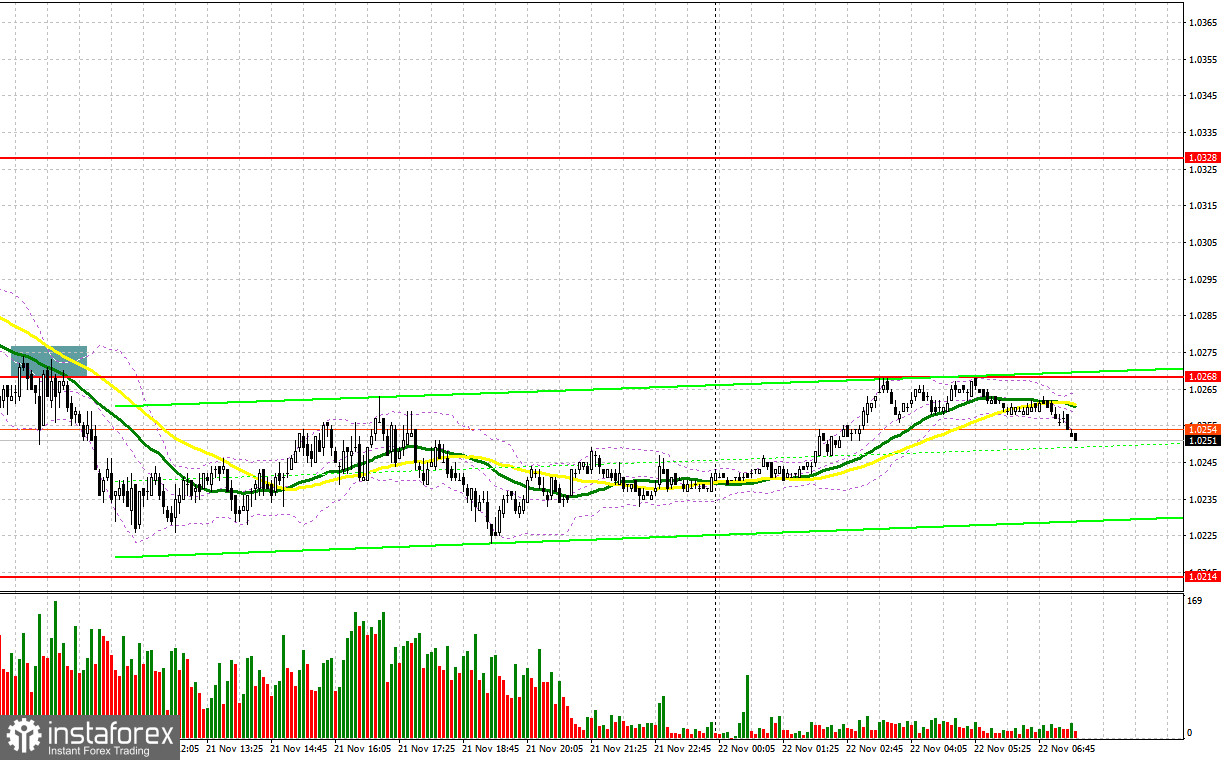
Yesterday, traders received just one signal to enter the market. Let us take a look at the 5-minute chart to clear up the market situation. Earlier, I asked you to pay attention to the level of 1.0268 to decide when to enter the market. A breakout and an upward test as well as bulls' failure to regain control over this level formed a perfect sell signal. By the moment of writing the article, the signal allowed traders to earn over 40 pips. Even positive data from Germany which unveiled a decline in the PPI in October failed to alter the situation. In the second part of the day, there were no entry points since the market volatility was very low.
Conditions for opening long positions on EUR/USD:
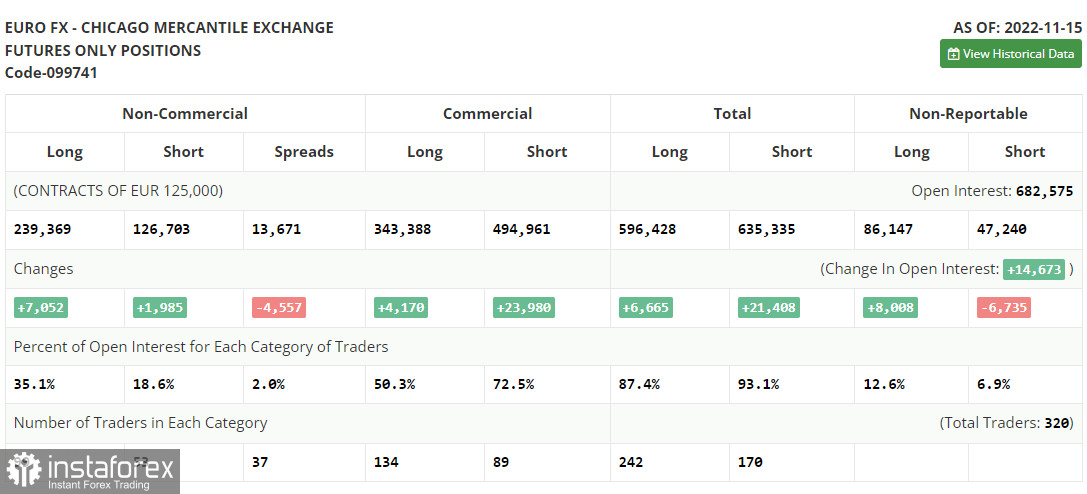
First of all, let us focus on the futures market and changes in the COT report. According to the COT report from November 15, the number of both long and short positions increased. There are more and more rumors that the Fed may switch to a less aggressive policy as early as December. However, such assumptions do not correspond to the recent rise in US retail sales in October. The data exceeded forecasts, pointing to the fact that inflation is likely to go on rising. That is why traders should be very cautious when analyzing the recent CPI report, which unveiled slower growth. It is highly possible that the Federal Reserve will remain stuck to its current policy, thus continuing to raise the benchmark rate. Demand for risk assets, including the euro, has increased. Judging by the recent data from the eurozone, especially the GDP growth rate, the euro/dollar pair is unlikely to show another jump until the end of the year. The COT report unveiled that the number of long non-commercial positions increased by 7,052 to 239,369, whereas the number of short non-commercial positions advanced by 1,985 to 126,703. At the end of the week, the total non-commercial net position remained positive at 112,666 compared to 107,599. This indicates that investors continue benefiting from the situation and buying the cheap euro below parity, as well as accumulating long positions, expecting the end of the crisis. The weekly closing price rose to 1.0390 against 1.0104.
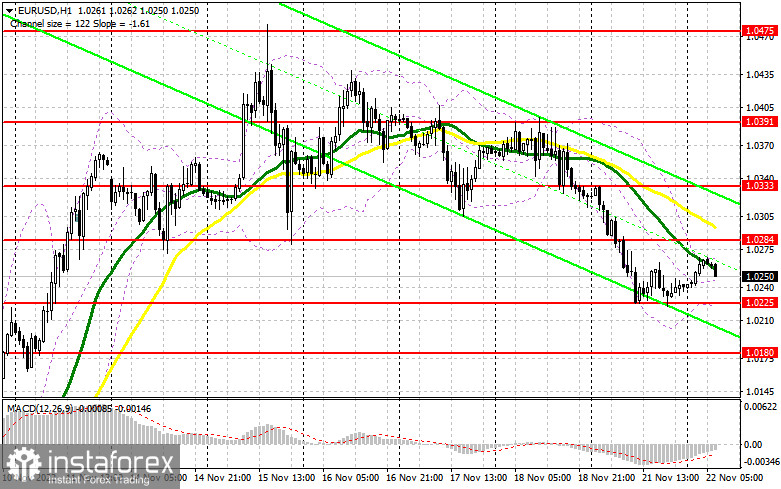
Today, there is no report that may support the euro. The eurozone current account and consumer confidence data will hardly stop the bearish correction. Comments that will be provided by German Buba Beermann may somehow affect the situation since Beermann supports an aggressive approach to the key interest rate hike. To maintain the bullish potential, traders should focus on the nearest support level of 1.0225. If the pair declines, only a false breakout of this area will give a long signal with the target above the nearest resistance level of 1.0284. There, we can see bearish MAs. A breakout and downward test of this area amid strong data will allow the pair to climb to a new high near 1.0333. This will provide traders with hope for a further rise to 1.0391. The farthest target is located at 1.0475. If the price touches this level, the market situation may change considerably. There, traders should lock in profits. If the euro/dollar pair drops and buyers fail to protect 1.0225, sellers will continue controlling the market. Only a false breakout near the next support level of 1.0180 will give a buy signal. Traders may also go long just after a bounce off the support level of 1.0132 or even lower – from the low of 1.0090, expecting a rise of 30-35 pips.
Conditions for opening short positions on EUR/USD:
Sellers are still active and may push the price even lower amid the absence of important macroeconomic data from the eurozone and lower demand for risk assets. Quite weak data from the eurozone will return pressure on the euro. Today, it will be wise to sell the asset after a false breakout near the closest resistance level of 1.0284 formed yesterday. A failure to settle at this level will cause a decline to 1.0225, yesterday's low. A breakout and settlement below this level as well as an upward test will give an additional sell signal, which will affect buyers' stop orders and cause a drop to 1.0180. There, traders should lock in profits. The pair may slide even deeper only amid strong data from the US. If the euro/dollar pair increases during the European session and bears fail to protect 1.0284, the pair may jump. In this case, traders are better to avoid selling until the price touches 1.0333. A false breakout of this level will allow traders to open sell orders. Traders may also go short just after a rebound from the high of 1.0391 or even higher – from 1.0475, expecting a decline of 30-35 pips.
Signals of indicators:
Moving Averages
Trading is performed below 30- and 50-day moving averages, which points to a decline in the euro.
Note: The period and prices of moving averages are considered by the author on the one-hour chart which differs from the general definition of the classic daily moving averages on the daily chart.
Bollinger Bands
If the pair drops, support will be situated at the lower limit of the indicator – at 1.0225. A breakout of the upper limit of the indicator located at 1.0260 will cause an increase in the euro.
Description of indicators
- Moving average (moving average, determines the current trend by smoothing volatility and noise). The period is 50. It is marked in yellow on the chart.
- Moving average (moving average, determines the current trend by smoothing volatility and noise). The period is 30. It is marked in green on the graph.
- MACD indicator (Moving Average Convergence/Divergence - convergence/divergence of moving averages). A fast EMA period is 12. A slow EMA period is 26. The SMA period is 9.
- Bollinger Bands. The period is 20.
- Non-profit speculative traders are individual traders, hedge funds, and large institutions that use the futures market for speculative purposes and meet certain requirements.
- Long non-commercial positions are the total number of long positions opened by non-commercial traders.
- Short non-commercial positions are the total number of short positions opened by non-commercial traders.
- The total non-commercial net position is a difference in the number of short and long positions opened by non-commercial traders.


