


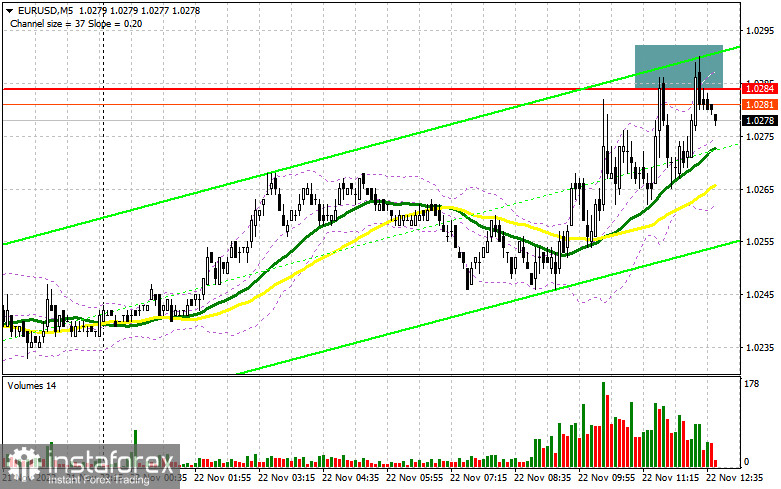
In my morning review, I outlined the level of 1.0284 and recommended entering the market from there. Let's have a look at the 5-minute chart. A rise to this range and its false breakout generated a sell signal which is still relevant at the moment of writing. As long as the price is holding below 1.0284, the pair is likely to move upwards. But if the bulls manage to consolidate even higher, it is advisable to close your sell positions as they won't bring you any profit. I left the technical picture and the strategy unchanged for the second half of the day.
For long positions on EUR/USD:
In the New York session, the Redbook Index on retail sales and the Richmond Manufacturing index will be published tonight. These events are of minor importance to the market. The euro may surge and rise above 1.0284 only after FOMC members Loretta Mester and James Bullard will give their speech. Yet, to boost the demand for risk assets, the officials should echo the words of their colleagues who previously said it was the right time to slow down the Fed's monetary tightening. Unless they say so, the pressure on the euro will return after its failed attempts to break above 1.0284. The best moment to go long after a decline will be a false breakout at the morning support of 1.0225. This will create the first signal to buy EUR/USD. After that, it may return to 1.0284 where the moving averages playing on the side of the bears are found. A breakout and a downward retest of this range will support the bulls and will pave the way towards 1.0333. A break above this level will open the door to a higher target of 1.0391 where I recommend profit taking. If EUR/USD declines in the North American session and buyers are idle at 1.0225, the euro will come under more pressure and may drop lower. If so, only a false breakout at the support of 1.0180 will be a good moment to open buy positions. Buying EUR/USD after a rebound is possible at 1.0132 or even at the low of 1.0090, bearing in mind an upside correction of 30-35 pips within the day.
For short positions on EUR/USD:
It seems that bears are not in a hurry to take the leading position in the market after yesterday's decline. Probably, that was the most they could do. So, the euro may start to recover anytime soon. If the US data turns out to be better than expected, the EUR/USD pair will continue its downward correction. The best moment to sell the pair will be its third failed attempt to move above 1.0284, similar to those I described above. This will create a good entry point and will allow the price to move lower to the nearest support of 1.0225. If the pair settles below this level and performs its upward retest, this will create another sell signal that will trigger stop-loss orders set by the bulls. If so, the pair may extend its fall to the area of 1.0180 where I recommend profit taking. The level of 1.0132 will serve as a more distant target, and testing this mark may cancel the bullish trend. In case EUR/USD rises in the course of the North American session and bears are idle at 1.0284, speculative sellers will start leaving the market. This will help the pair resume its bullish trend and will pave the way to 1.0333. Selling at this point can be done only after a false breakout. Going short on EUR/USD right after a rebound is possible at the high of 1.0391, keeping in mind a downward intraday correction of 30-35 pips.
COT report
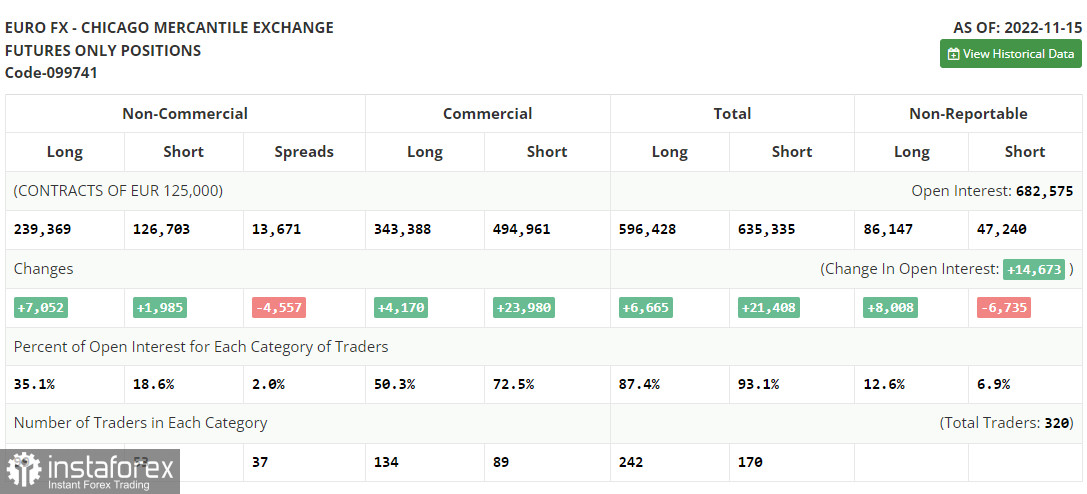
The Commitments of Traders report for November 15 showed a rise in both short and long positions. There have been speculations lately that the Fed may ease its current aggressive monetary policy starting this December. At the same time, these assumptions contrast with the recent US retail sales data revealing that the indicator increased in October. Moreover, the report has surpassed all forecasts, clearly indicating that inflationary pressures remain strong at the end of the year. Therefore, the recent CPI report from the US demonstrating a slowdown in prices should be taken with caution. Apparently, the US Federal Reserve will stick to its plan and will keep raising rates. As for the euro, the demand for risk assets has indeed increased. However, amid the recent GDP data in the eurozone, the euro/dollar pair is very unlikely to perform a strong upward movement until the end of the year. According to the COT report, long positions of the non-commercial group of traders increased by 7,052 to 239,369 while short positions rose by 1,985 to 126,703. The non-commercial net position remained positive and stood at 112 666 compared to 107 599 a week earlier. This indicates that investors are taking advantage of a cheaper euro and continue to buy it even though it is holding above the parity level. They might also be accumulating long positions in hope that the pair will start to recover sooner or later. The weekly closing price advanced to 1.0390 from 1.0104.
Indicator signals:
Moving Averages
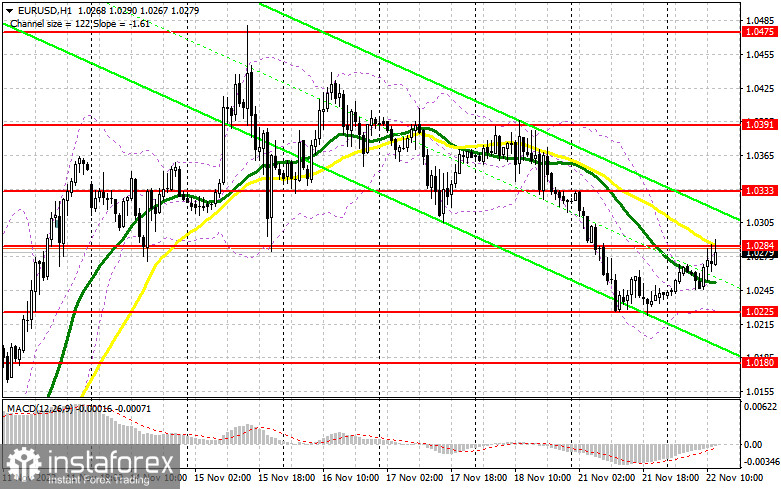
Trading below the 30- and 50-day moving averages indicates that the euro is set to decline further.
Please note that the time period and levels of the moving averages are analyzed only for the H1 chart, which differs from the general definition of the classic daily moving averages on the D1 chart.
Bollinger Bands
If the pair advances, the upper band of the indicator at 1.0284 will act as resistance.
Description of indicators:
• A moving average of a 50-day period determines the current trend by smoothing volatility and noise; marked in yellow on the chart;
• A moving average of a 30-day period determines the current trend by smoothing volatility and noise; marked in green on the chart;
• MACD Indicator (Moving Average Convergence/Divergence) Fast EMA with a 12-day period; Slow EMA with a 26-day period. SMA with a 9-day period;
• Bollinger Bands: 20-day period;
• Non-commercial traders are speculators such as individual traders, hedge funds, and large institutions who use the futures market for speculative purposes and meet certain requirements;
• Long non-commercial positions represent the total number of long positions opened by non-commercial traders;
• Short non-commercial positions represent the total number of short positions opened by non-commercial traders;
• The non-commercial net position is the difference between short and long positions of non-commercial traders.


