


Analysis of GBP/USD, 5-minute chart
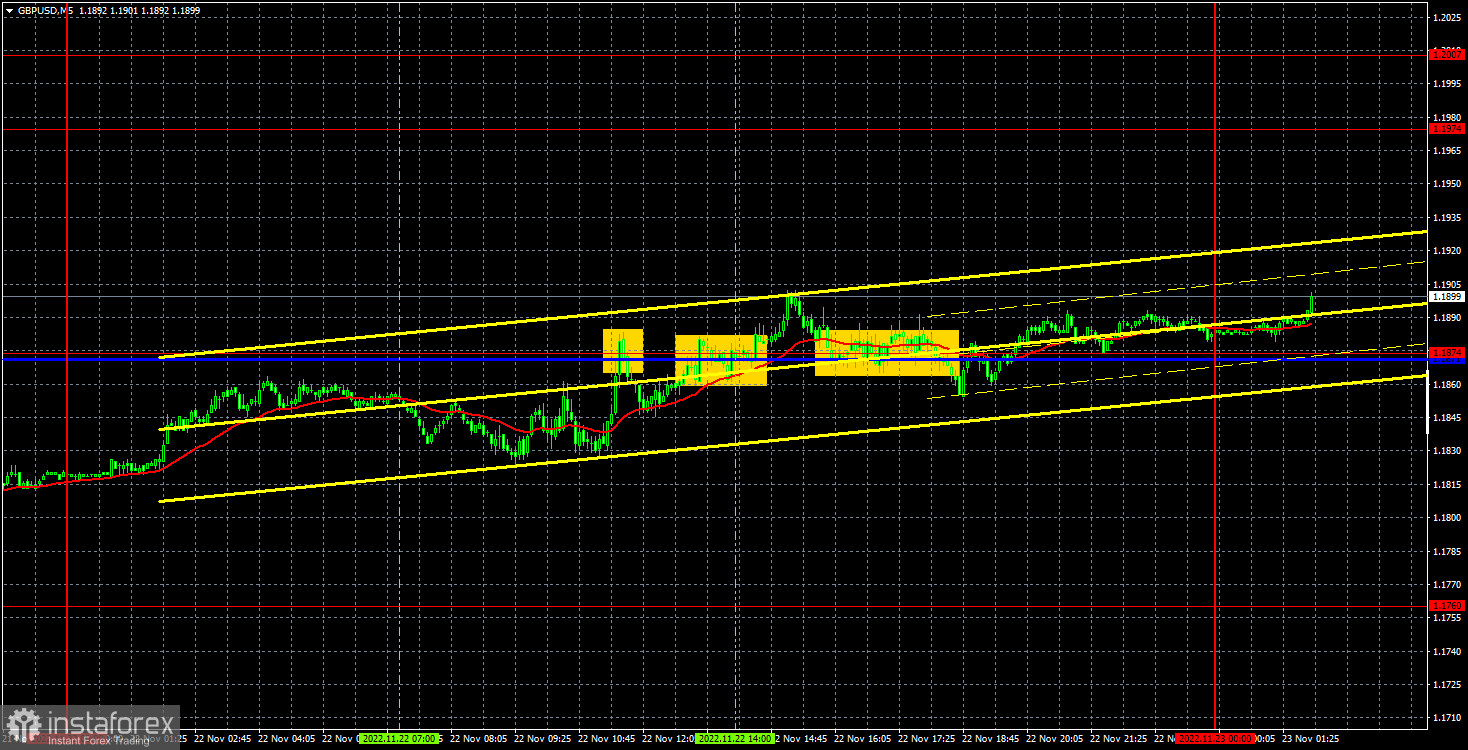
The GBP/USD currency pair also rose on Tuesday but it was still above the ascending trend line on Monday, so in this case the growth is justified. Nevertheless, I don't think that pairs can move in different directions for a long period of time when there is no macroeconomic or fundamental background. Therefore, the pound might settle below the trend line, too, in the near future. Actually, some reports will be released today in the UK and the USA, which might at least have some effect on the traders' mood. Take note that the pound has even more technical reasons to rise now. The pair returned to the area above the critical line, but it keeps on trading between the levels 1.1760-1.1974, i.e. in a wide horizontal channel. Therefore, the price can still rise to 1.1974 in the coming days.
Since the pound also showed a flat movement for most of yesterday, it is not surprising that all the signals that formed near the same level were false. As in the case of the euro, traders could try to work out the first two signals. In the first case, it did not pass 20 pips downwards, so you could have incurred a small loss on this position. In the second case, the price passed 20 pips upwards, so a Stop Loss should have been set to Breakeven, which was used to close the trade. Not the best trading day, but considering the nature of the movement, it is not as bad as it could have been.
COT report
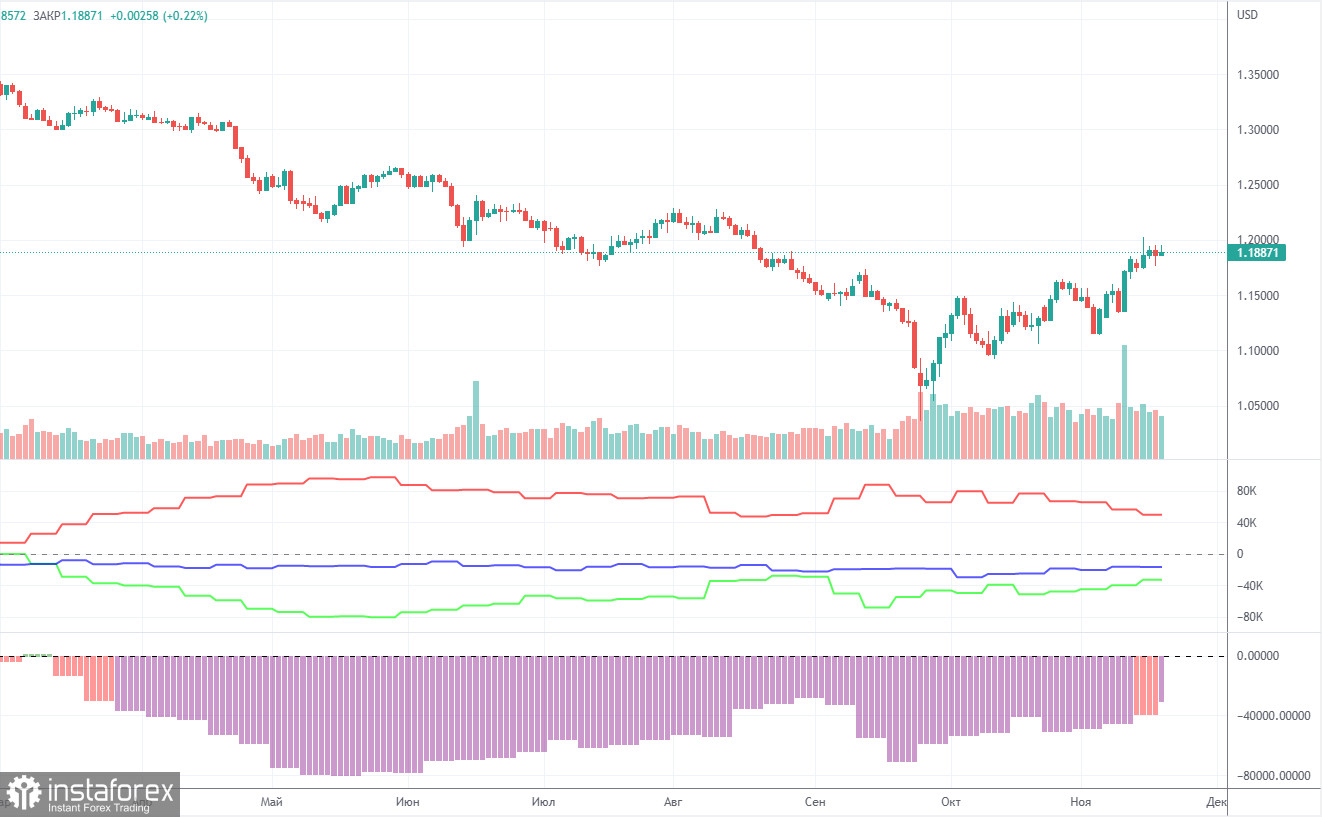
The latest Commitment of Traders (COT) report on GBP logged a slight decrease in bearish sentiment. In the given period, the non-commercial group closed 1,900 long positions and 11,500 short positions. Thus, the net position of non-commercial traders increased by 3,000, which is very small for the pound. The net position is gradually growing during the last months, but the sentiment of the big players is still bearish. The pound has been rising in recent weeks, but so far it does not seem that it is preparing for a long-term uptrend. And, if we remember the euro's situation, then based on the COT reports, we can hardly expect a surge in price. The demand for the US currency remains very high, and the market, as it seems, is just waiting for new geopolitical shocks so it can return to buying the dollar. The non-commercial group now has a total of 67,000 shorts and 34,000 longs opened. As we can see, there is a wide gap between them. As it turns out the euro is now unable to show growth when market sentiment is bullish. When it comes to the total number of long and short positions, here bulls have an advantage of 17,000. Still, this is not enough for the sterling to increase. Anyway, we are still skeptical about the pound's long-term growth although the technical picture shows otherwise.
Analysis of GBP/USD, 1-hour chart
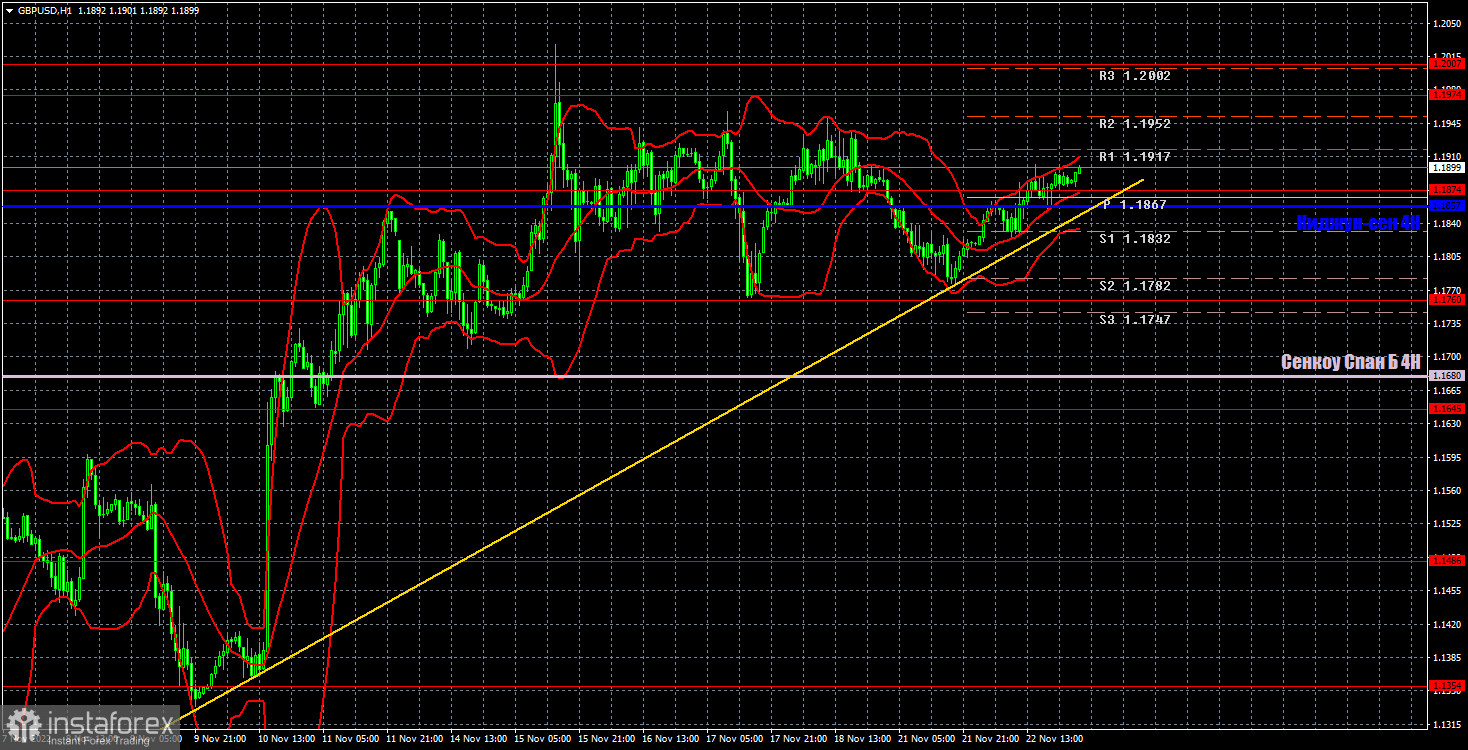
The pound/dollar pair refuses to correct on the one-hour chart, it has been within the horizontal channel at 1.1760-1.1974. At the same time, the uptrend line is still relevant, so we have a right to expect that the pound will rise further. Despite the fact that we expect a strong bearish correction, there are no specific technical reasons for the pair's downfall now. On Wednesday, the pair may trade at the following levels: 1.1486, 1.1645, 1.1760, 1.1874, 1.1974-1.2007, 1.2106. Senkou Span B (1.1680) and Kijun-Sen (1.1857) lines may also generate signals. Pullbacks and breakouts through these lines may produce signals as well. A Stop Loss order should be set at the breakeven point after the price passes 20 pips in the right direction. Ichimoku indicator lines may move during the day, which should be taken into account when determining trading signals. In addition, the chart does illustrate support and resistance levels, which could be used to lock in profits. The UK and the US will both publish interesting data, but they aren't necessarily that important. I think that the most interesting data would have to be the business activity index, but if the results do not differ much from the forecasted values, the reaction might be very weak or no reaction at all.
What we see on the trading charts:
Price levels of support and resistance are thick red lines, near which the movement may end. They do not provide trading signals.
The Kijun-sen and Senkou Span B lines are the lines of the Ichimoku indicator, moved to the one-hour chart from the 4-hour one. They are strong lines.
Extreme levels are thin red lines from which the price bounced earlier. They provide trading signals.
Yellow lines are trend lines, trend channels, and any other technical patterns.
Indicator 1 on the COT charts reflects the net position size of each category of traders.
Indicator 2 on the COT charts reflects the net position size for the non-commercial group.


