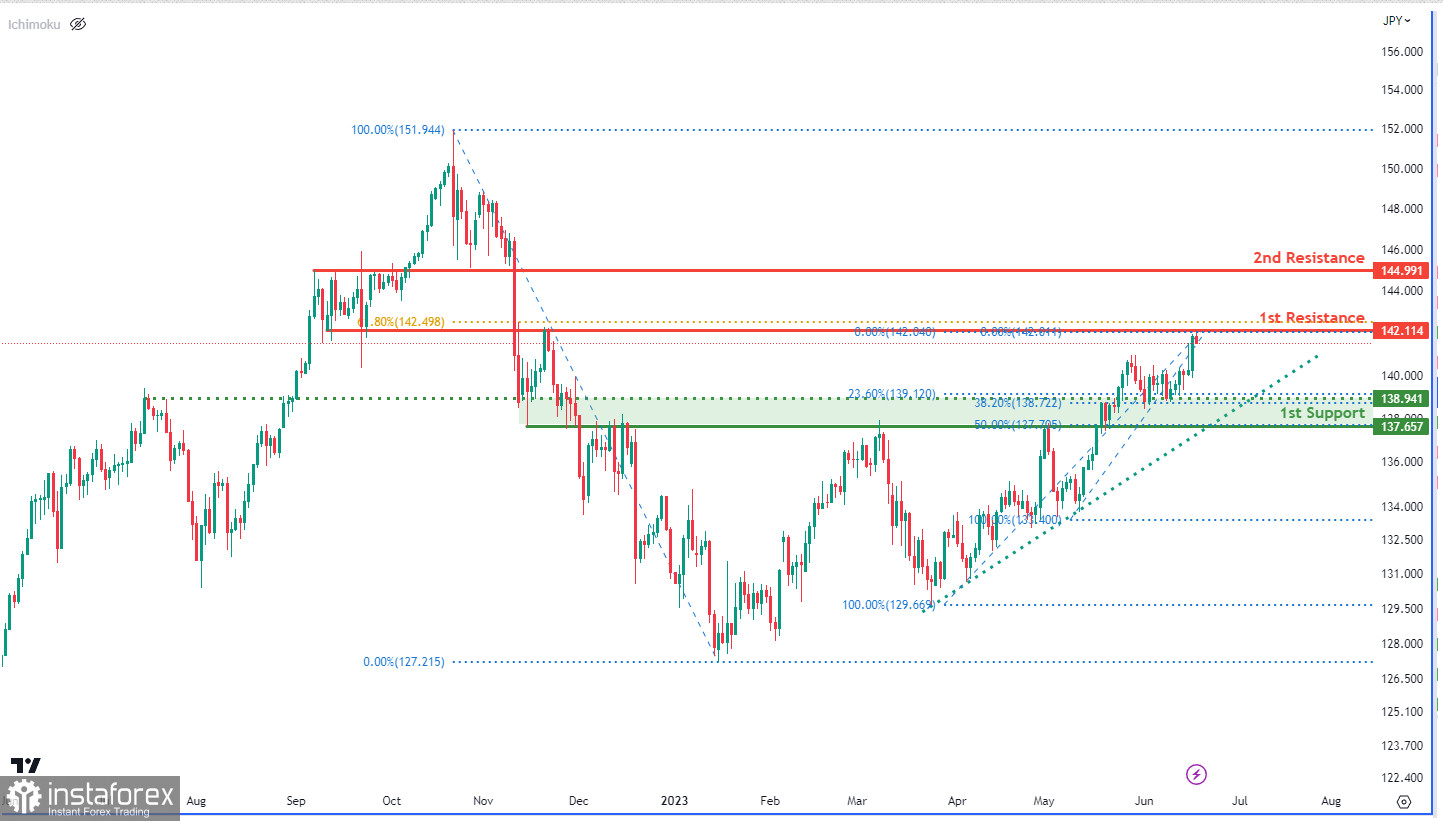
The USD/JPY chart indicates a bearish momentum, suggesting a downward trend. However, the price is still above a major ascending trend line, indicating potential bullish momentum.
There is a chance of a bearish reaction at the first resistance level of 142.11, leading to a potential decline towards the first support level at 137.65. The intermediate support at 138.94, aligned with the 38.20% Fibonacci Retracement, further emphasizes its importance for potential price stabilization.
On the upside, the first resistance level at 142.11 acts as an overlap resistance and aligns with the 61.80% Fibonacci Retracement, serving as a significant barrier to upward price movements. The second resistance level at 144.99 is a Fibonacci confluence, coinciding with the 50% and 38.20% Fibonacci Retracement levels, reinforcing its role as a notable pullback resistance.


