


Trend analysis (Fig. 1).
The pound-dollar pair may move upward from the level of 1.1882 (closing of yesterday's daily candle) to the upper fractal at 1.2026 (yellow dotted line). In the case of testing this level, continued upward movement is possible to 1.2213, the historical resistance level (blue dotted line). When testing this level, the price may move down.
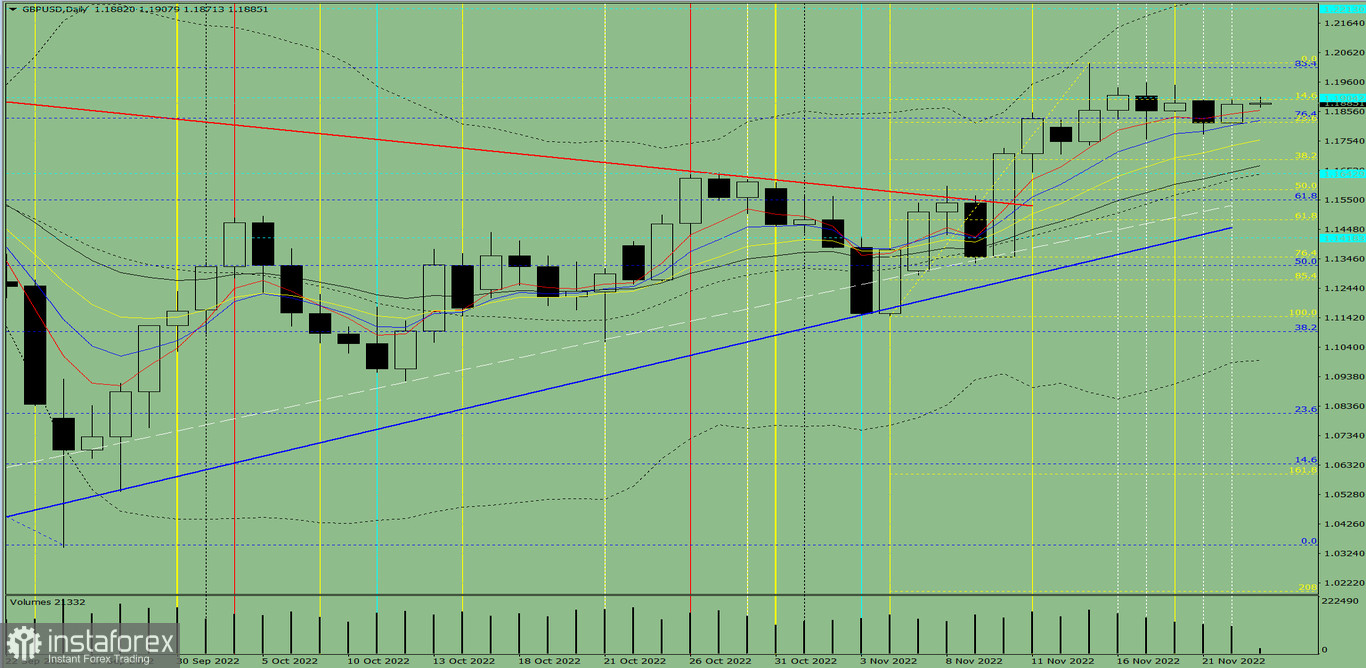
Fig. 1 (daily chart).
Comprehensive analysis:
- Indicator analysis - up;
- Fibonacci levels - up;
- Volumes - up;
- Candlestick analysis - down;
- Trend analysis - up;
- Weekly chart - up;
- Bollinger Bands - up.
General conclusion:
Today, the price may move upward from the level of 1.1882 (closing of yesterday's daily candle) to the upper fractal at 1.2026 (yellow dotted line). In the case of testing this level, continued upward movement is possible to 1.2213, the historical resistance level (blue dotted line). When testing this level, the price may move down.
Alternatively, the price may move upward from the level of 1.1882 (closing of yesterday's daily candle) to the upper fractal at 1.2026 (yellow dotted line). In the case of testing this level, a downward movement is possible to 1.1904, the historical resistance level (blue dotted line). When testing this level, the price may move up.


