


EUR/USD
Higher time frames
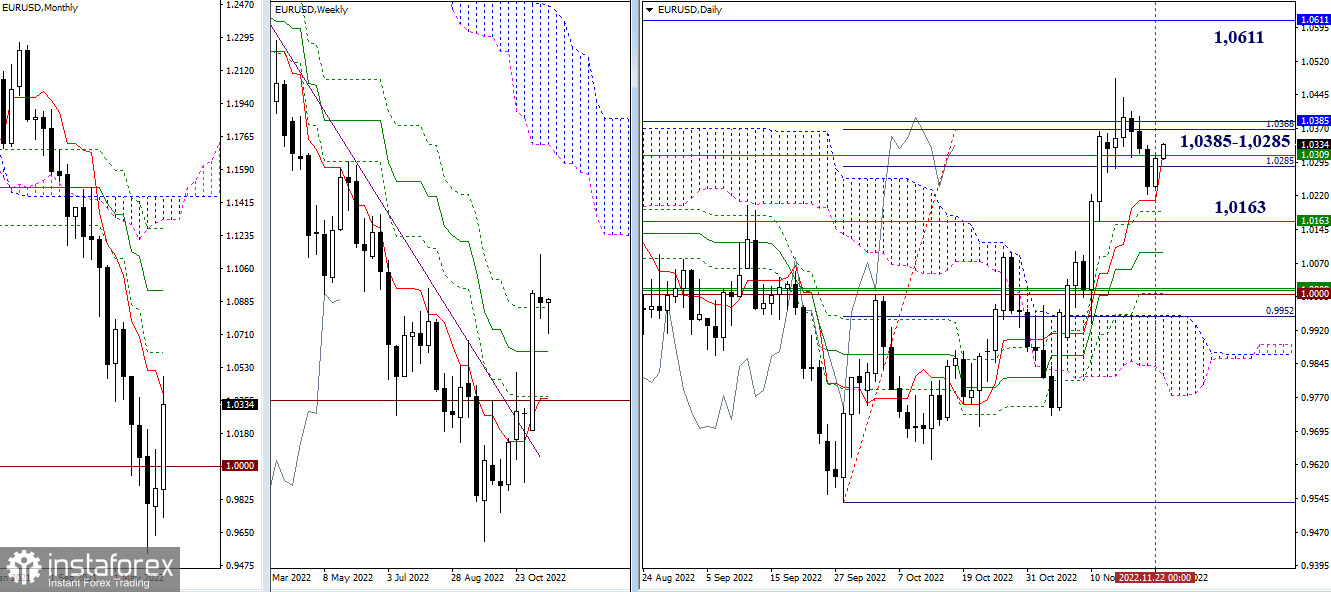
Yesterday, bulls seized the initiative and stopped the ongoing decline. They returned the price to the strong support area formed by the key levels of 1.0285 – 1.0385 on higher time frames. The short-term uptrend gained momentum, thus supporting the bulls. If the bullish bias becomes stronger and the pair manages to regain ground, the price may head for the monthly resistance level of 1.0611 after leaving the strong support zone. If this attempt is unsuccessful, the pair may decline toward the weekly medium-term target of 1.0163.
H4 – H1
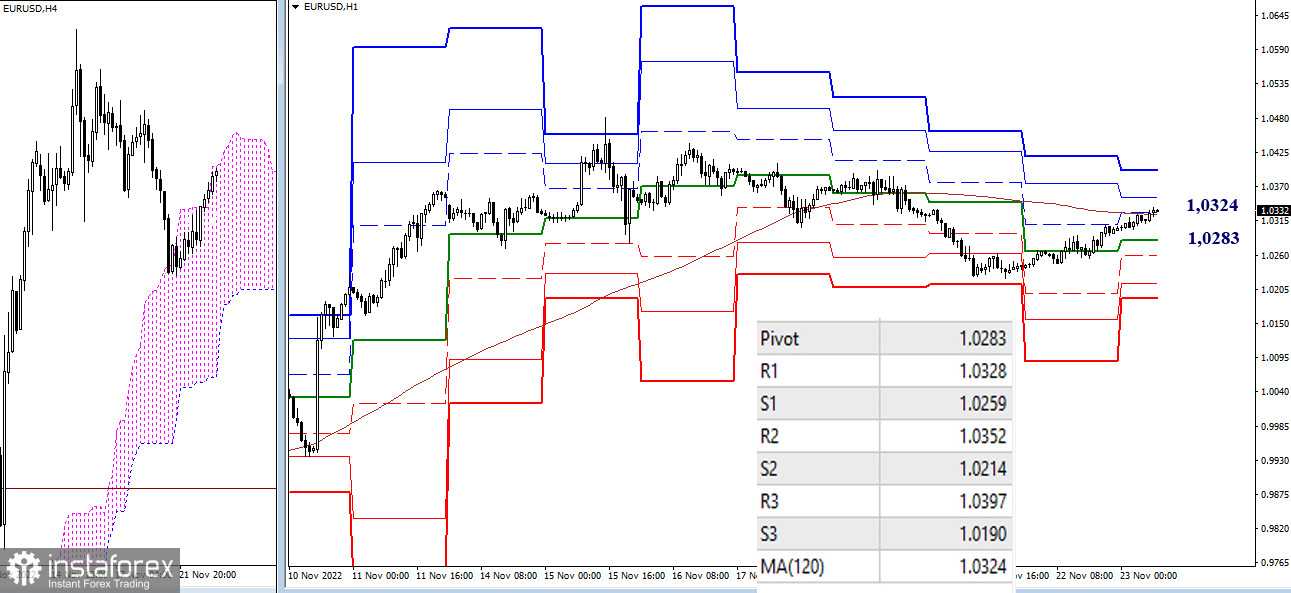
By now, buyers have managed to push the pair up to the weekly long-term resistance at 1.0324 on lower time frames. This is the key level where the market balance may change. If bulls prevail after testing this level, they will take full control of the pair. In this case, the upward targets will be found at 1.0352 and 1.0397 (standard pivot levels). A bearish scenario will be activated if the price rebounds from 1.0324, reaches the central pivot level of 1.0283, and leaves this zone by testing the low of 1.0233 and settling below it.
***
GBP/USD
Higher time frames
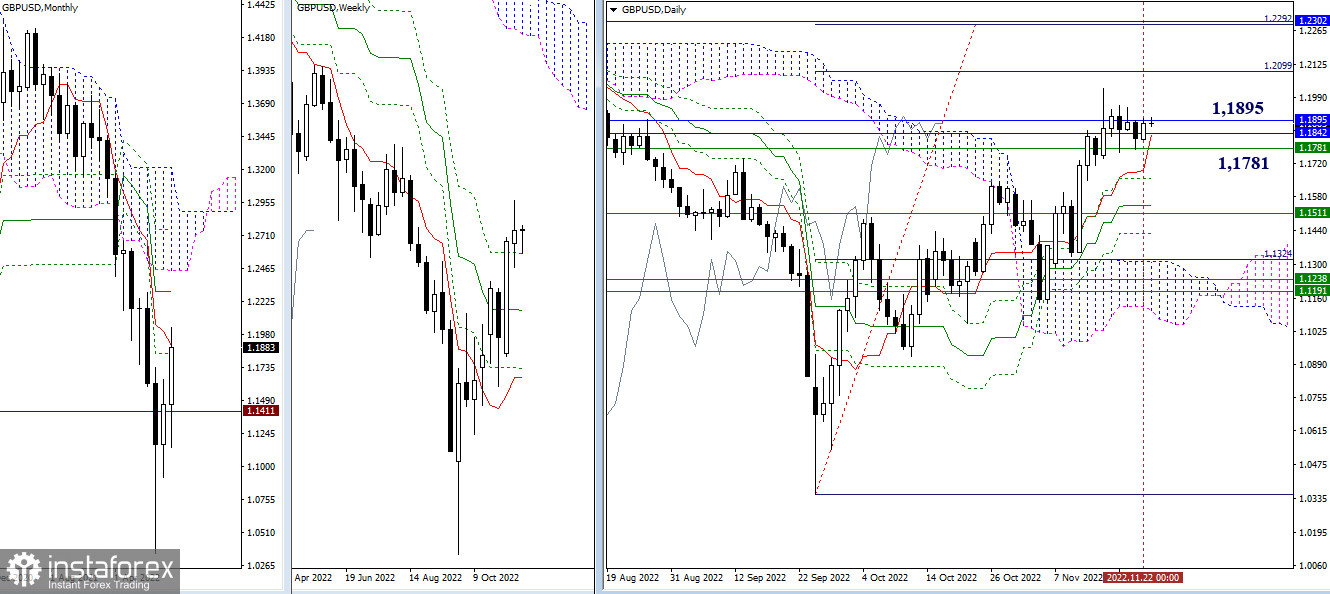
The price continues to consolidate in the support area of 1.1781 – 1.1842 – 1.1895. Therefore, all the previous conclusions and forecasts are still relevant. The nearest daily upward targets for bulls are found at 1.2099 – 1.2292. This zone is reinforced by a monthly medium-term trend observed at 1.2302. As for bears, their main task will be to break through the daily and weekly support levels of 1.1658 – 1.1544 – 1.1511 going further.
H4 – H1
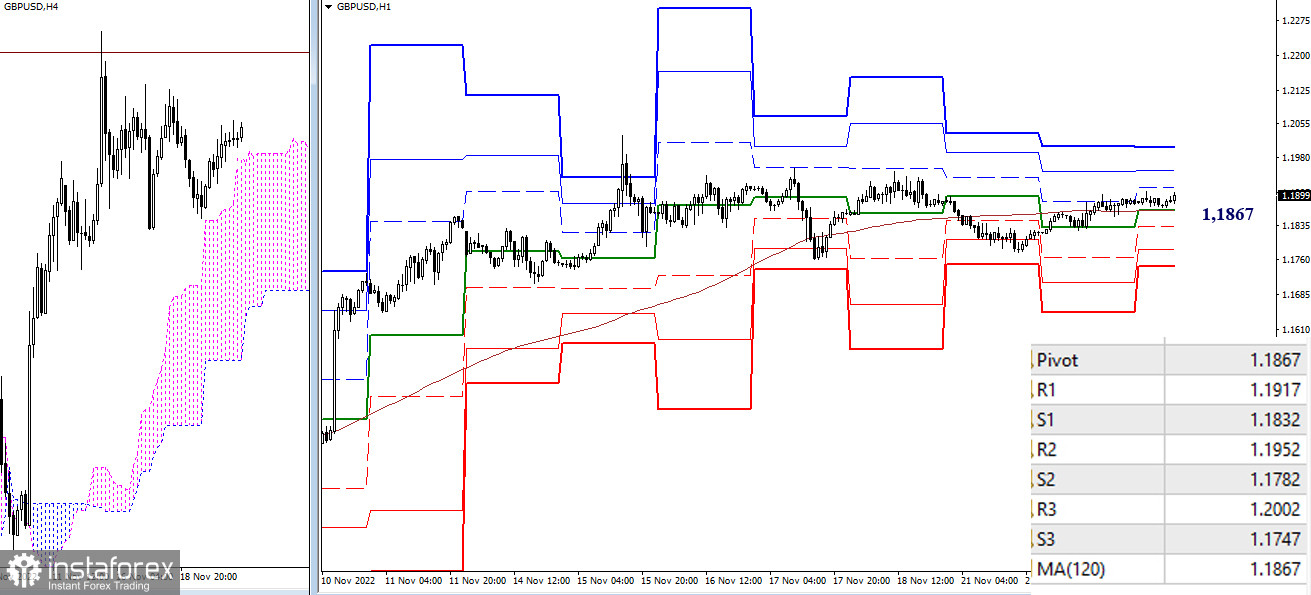
The key levels on lower time frames, including the key pivot level and the weekly long-term trend, crossed at the point of 1.1867. trading above this level will indicate a bullish market. The upward targets are located at 1.1917 – 1.1952 – 1.2002 (resistance at standard pivot levels). Trading below this range will mean that bears are prevailing. If so, their downward targets will be found at 1.1832 – 1.1782 – 1.1747 (support at standard pivot levels).
***
Technical analysis is based on:
Higher time frames – Ichimoku Kinko Hyo (9.26.52) + Fibo Kijun levels
H1 – Pivot Points (standard) + 120-day Moving Average (weekly long-term trend)


