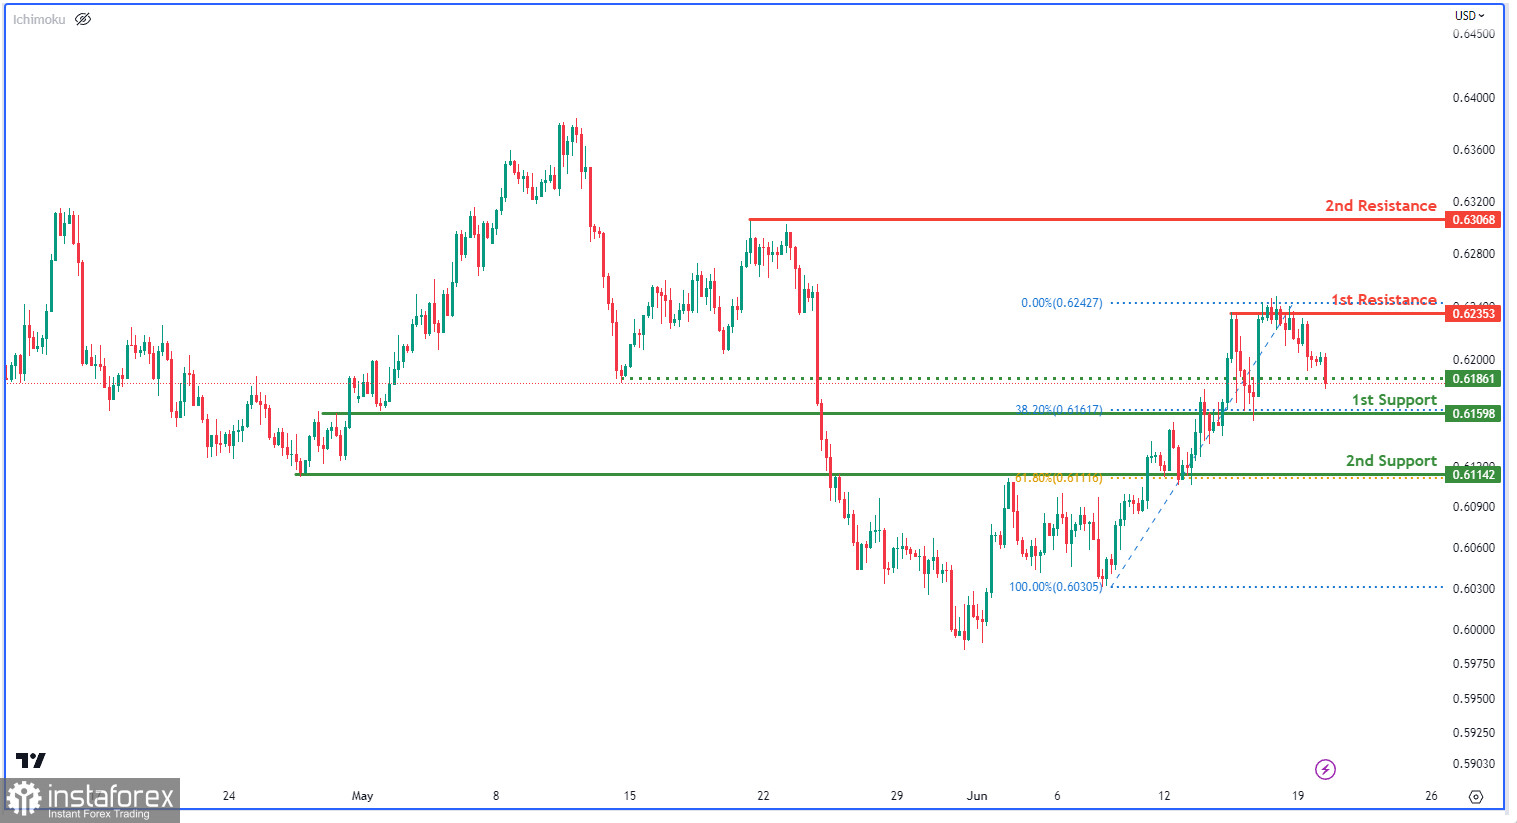
The NZD/USD chart exhibits a bearish momentum, indicating a downward trend. Traders should be mindful of the possibility of a bearish continuation towards the first support level at 0.6159, which aligns with the 38.20% Fibonacci Retracement. Additionally, the second support level at 0.6114 corresponds to the 61.80% Fibonacci Retracement, reinforcing its significance as an overlap support.
On the upside, traders should consider the first resistance level at 0.6235 as a multi-swing high resistance. The second resistance level at 0.6306 acts as a swing high resistance. Furthermore, the intermediate support level at 0.6159 functions as a pullback support.


