The volatility in the cryptocurrency market began to decline, which is reflected in the movement of quotes of the main digital assets. The stage of panic sales and impulsive price movements has come to an end. Now the market is moving to the stage of consolidation and systematic redistribution of BTC and ETH coins.
Ahead of the weekend, we saw positive signals from the market leaders: protection of important support levels and subsequent reversal with a local recovery price movement. Thus, the bulls managed to stabilize the situation and reduce the selling pressure.
BTC/USD Analysis
Despite the strong defense of the $15.5k level and the subsequent upward movement towards the $16.5k–$16.6k price range, Bitcoin still has chances to update the local bottom. It is important for the cryptocurrency to continue its bullish movement and gain a foothold above $16.6k, where the mass BTC buying zone begins in mid-November.
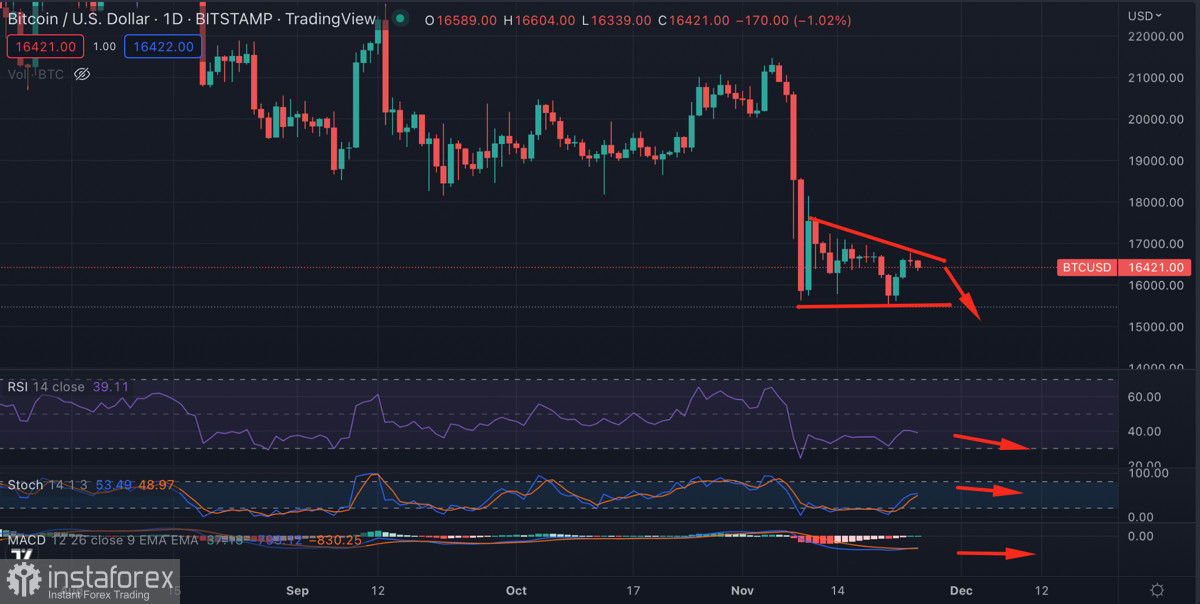
On the daily chart of Bitcoin, the "triangle" figure also remains relevant, which can be broken in a downward direction. However, the strong defense of the $15.5k level delayed this moment. Despite this, sellers continue to dictate their terms on the market.
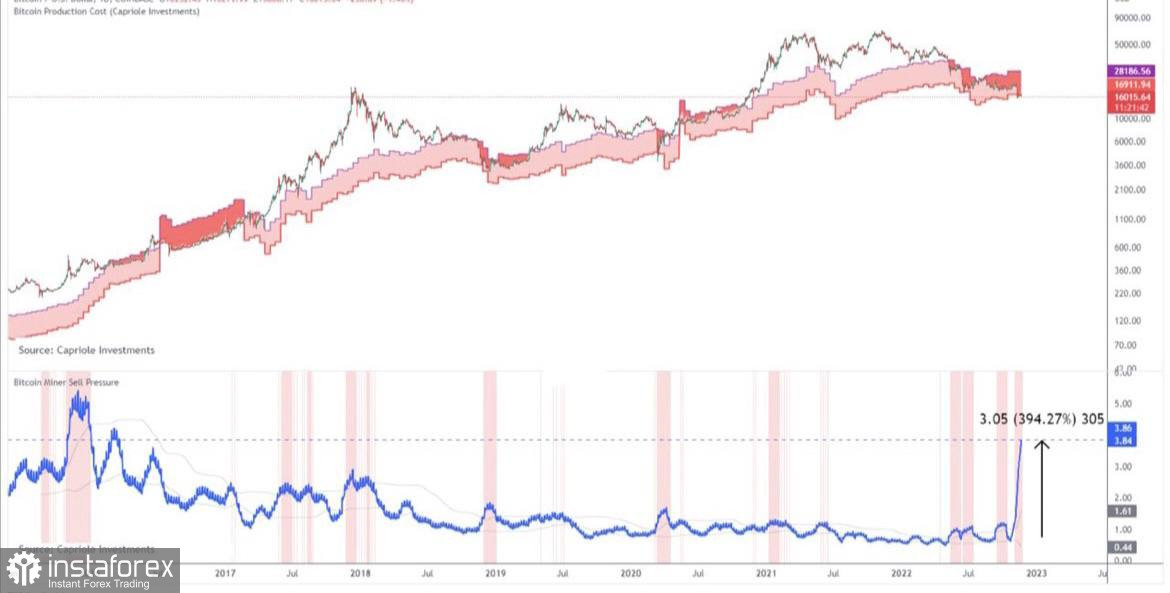
After the local stabilization of the situation, miners became the main source of pressure on Bitcoin quotes. According to on-chain metrics, the last five days have seen record levels of BTC miner capitulation in seven years.
Technical metrics on the 1D timeframe point to the exhaustion of the bullish forces and the gradual slide of the price towards $16k. The buyers managed to test the $16.6k–$16.8k level, but the pressure from the sellers provoked a price reversal towards the local bottom.
The RSI index is turning downward, and the stochastic oscillator is preparing to form a bearish crossover. At the same time, the MACD is turning flat and hasn't formed a bullish crossover.
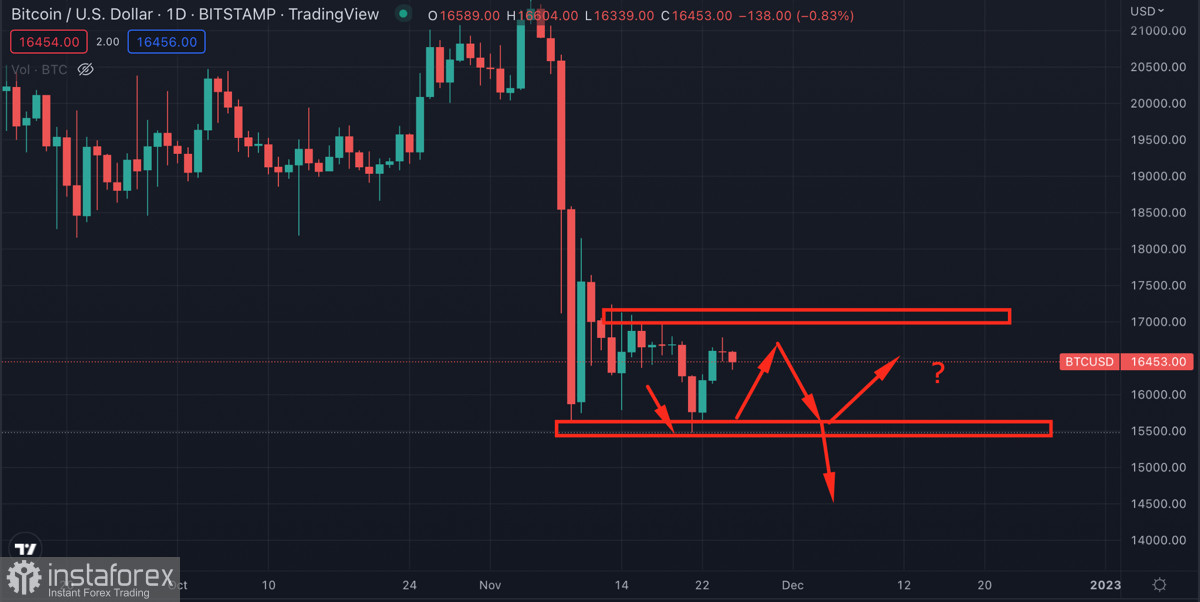
All these facts indicate that the price of Bitcoin, having rebounded from the local bottom at $15.5k, unsuccessfully tested the $16.6k–$16.8k resistance level. This means that on the weekend, even with a decrease in trading activity, we should expect another $15.5k assault, which significantly increases the likelihood of updating the local bottom.
ETH/USD Analysis
On the daily chart of Ethereum, there is a situation similar to the price movement of Bitcoin. The bulls managed to protect the support level of $1,068, after which the price went to the upper border of the current channel. ETH/USD met resistance near the $1,200 level but still has chances to hold an important milestone.
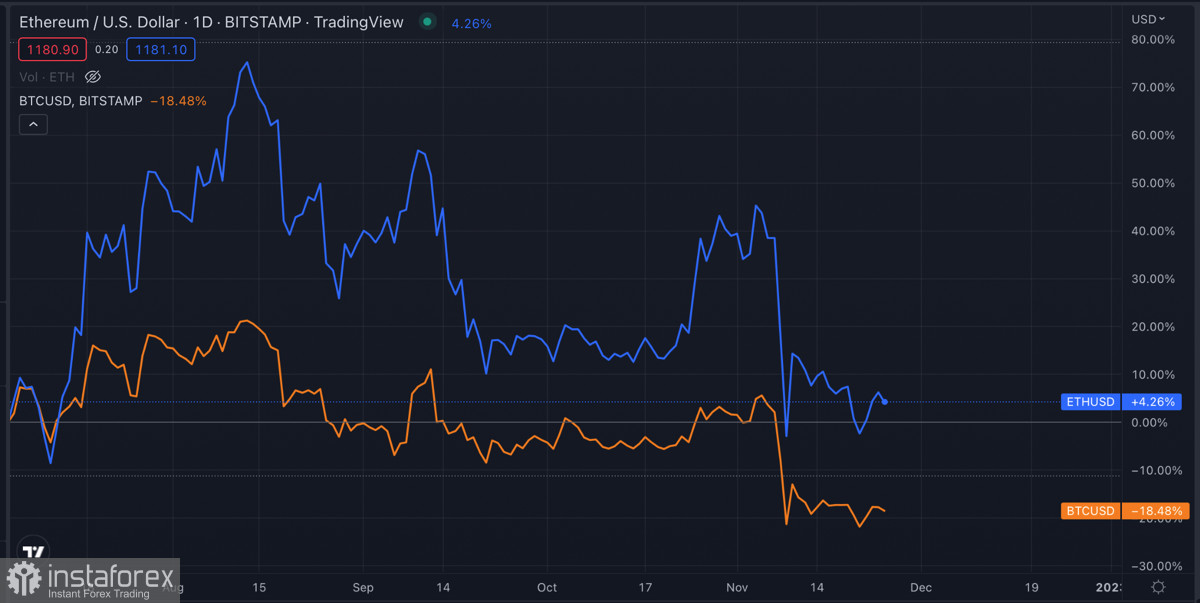
However, as of writing, the four-hour chart of ETH indicates further price declines. The RSI and stochastic are declining, indicating growing selling pressure. The $1,175 milestone was broken despite a local rebound attempt.
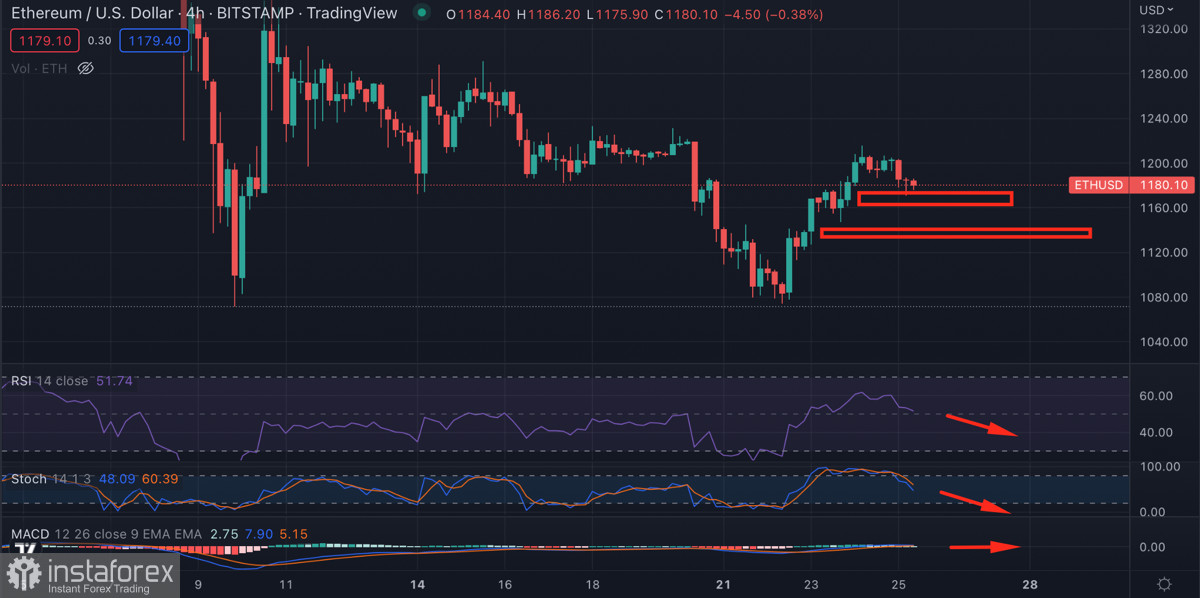
The price of ETH is moving towards the next support zone at $1,147, however, if the current momentum continues, the level will be broken, and the price will retest $1,000–$1,100. And given the bearish sentiment of Bitcoin and the relationship with ETH, the altcoin is expecting another wave of decline if BTC buyers do not become more active.
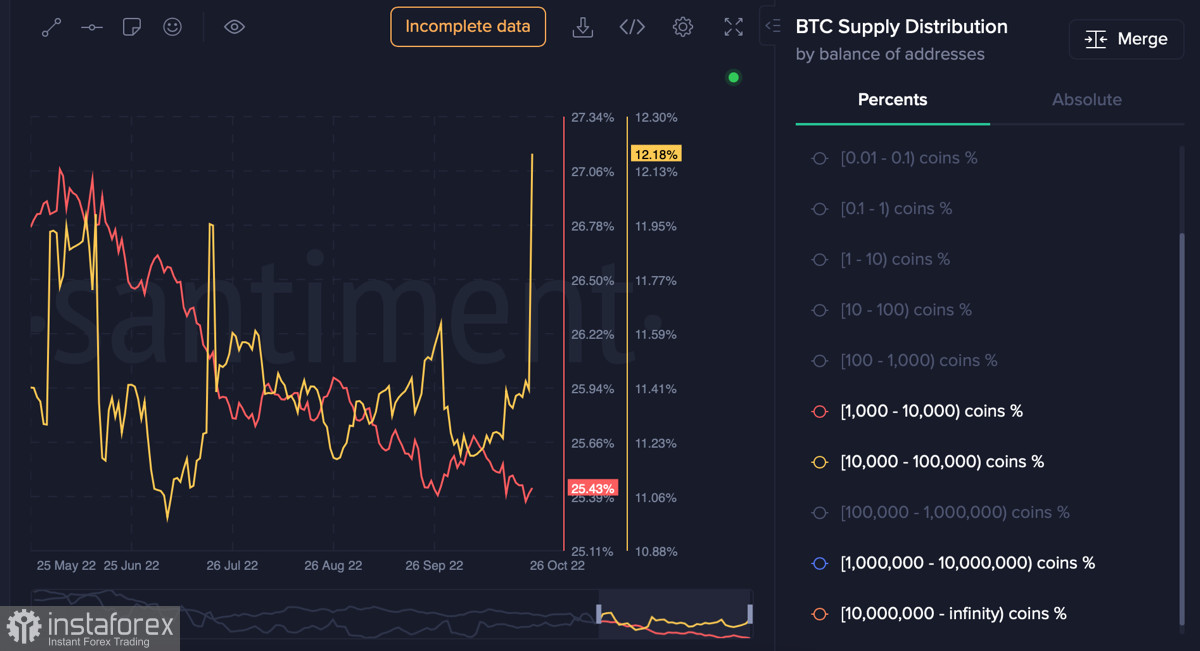
At the same time, fundamentally, ETH is becoming a priority option for investors. According to Santiment, the active addresses of "sharks" and "whales" continue to actively accumulate ETH, which indicates a gradual redistribution of capital and the formation of a local bottom.
Results
With a high degree of probability, Bitcoin and Ethereum will continue to decline on the basis of the current trading day. The decrease in trading activity over the weekend will not prevent the bears from trying to test the main support zones in order to update the local bottom of both assets.
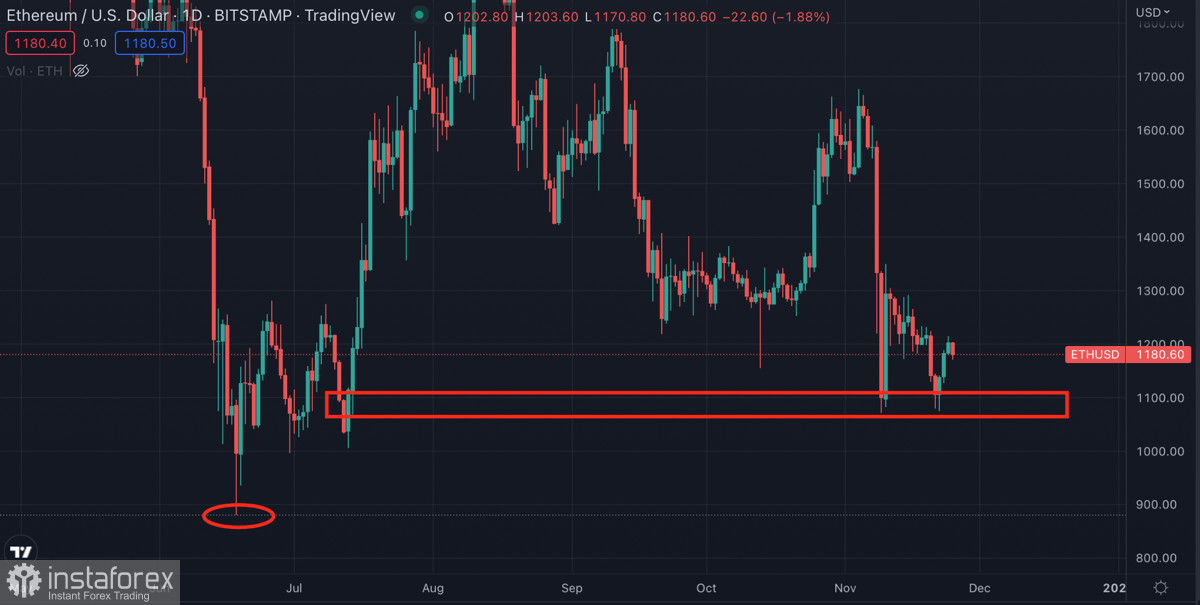
And if Bitcoin has every chance to update the local bottom, then ETH will most likely keep the current milestone at $875, formed in June 2022.


