


Analyzing Friday trades:
GBP/USD on 30M chart
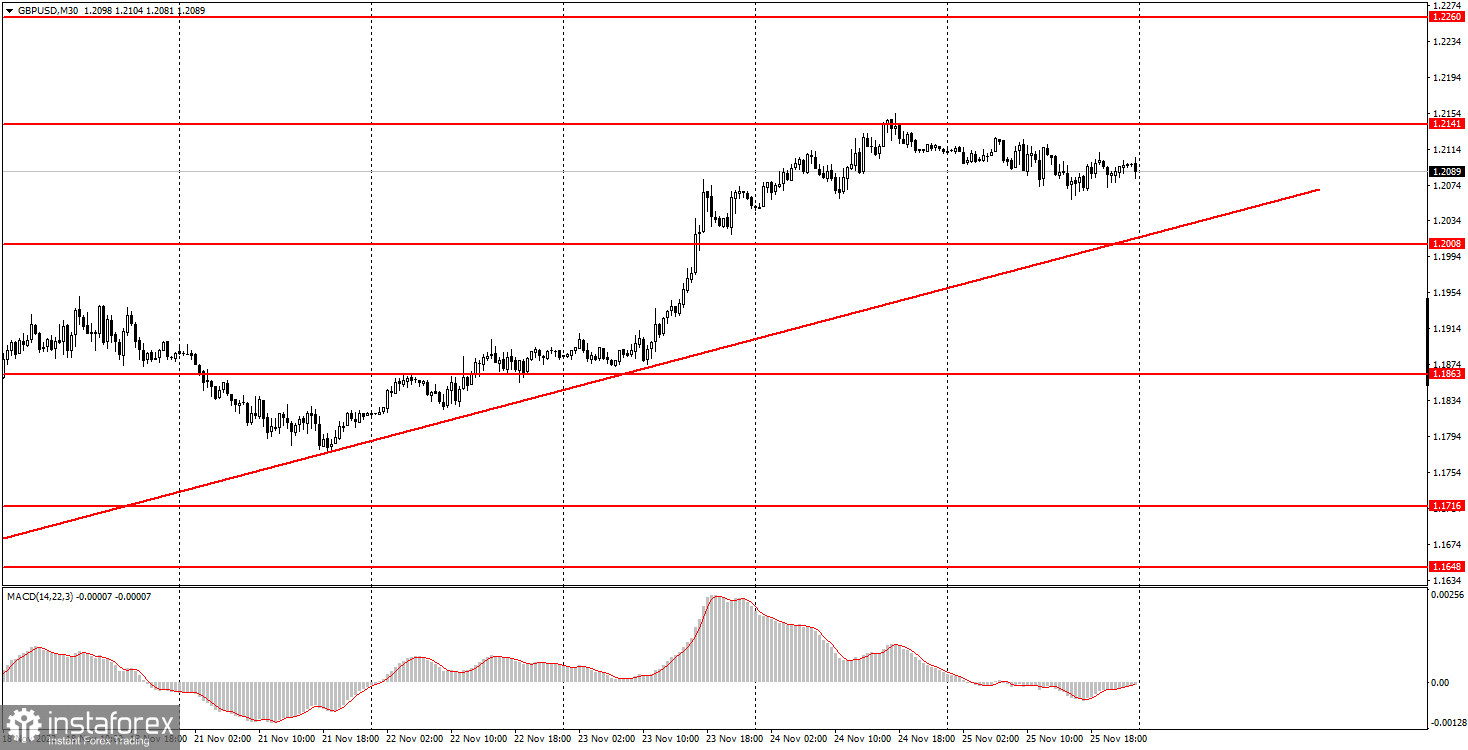
GBP/USD showed even worse movement than EUR/USD on Friday. If the euro showed at least some form of local movements during the day, then the pound was flat. Again, it is not surprising since there was no fundamental and macroeconomic background. The market fully worked out the news about the British Supreme Court's decision not to hold an independence referendum in Scotland without Westminster approval, so now we need new growth factors for the pound. As I mentioned before, the pound has plenty of technical reasons for its growth. We even have a clear uptrend line on the 30-minute chart, so the British currency's growth is justified, at least technically. The picture is approximately the same on the other charts as well. I still expect a downward correction, but in this case, the pound needs to settle below the trend line.
GBP/USD on M5 chart
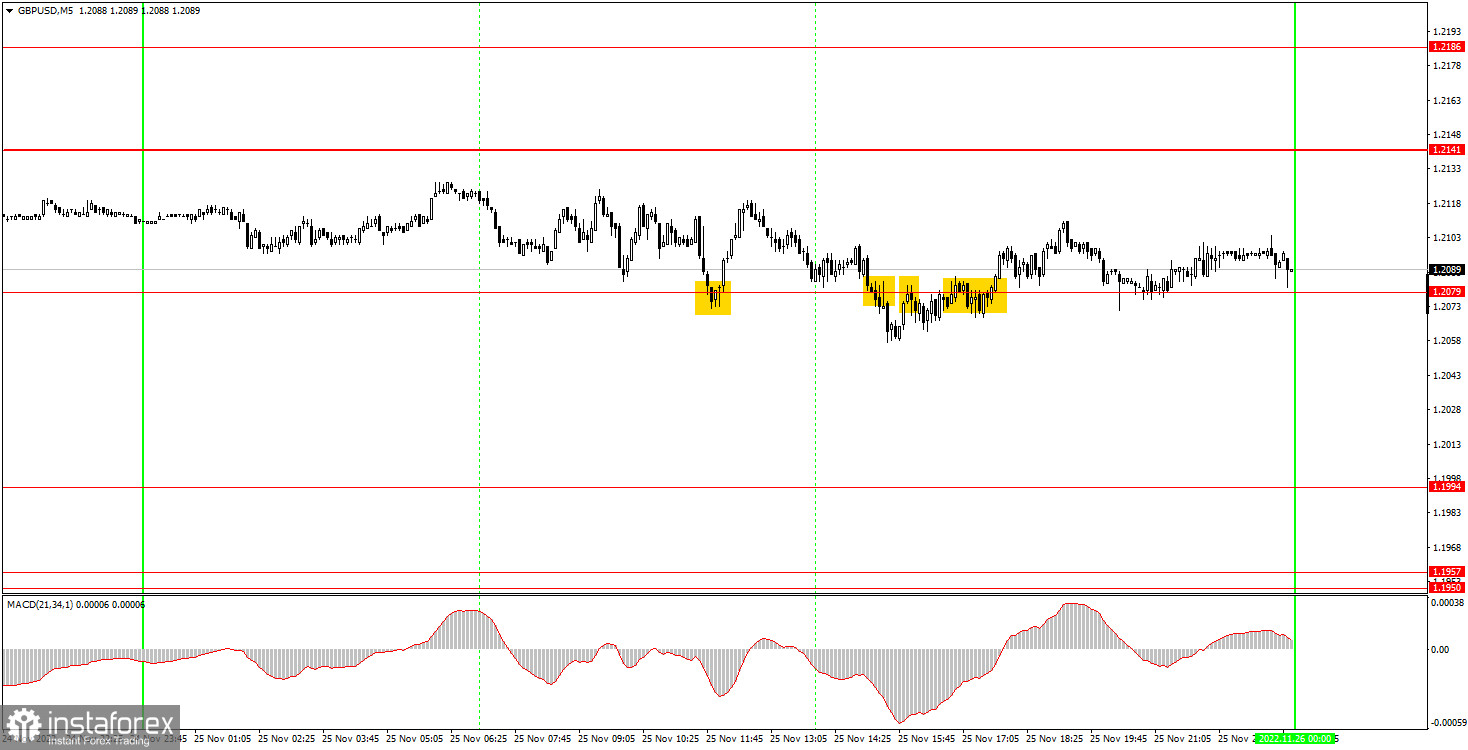
On the 5-minute chart, all trading signals turned out to be false due to the flat movement. If beginners could not lose money using the first buy signal near the level of 1.2079, since the price passed 20 points that was required for a Stop Loss, then all subsequent signals were just simply unprofitable. It's a good thing that our trading system does not recommend traders to work out more than two signals near the same level if the first two turned out to be false. Therefore, beginners didn't make any loss or profit on the first trade, while the second one (settling below the 1.2079 level at the beginning of the US session) incurred only a small loss. Traders shouldn't have used the third and fourth signals. The daily volatility rate was about 70 pips which is very low for the pound.
Trading tips on Monday:
The uptrend is still maintained on the 30-minute time frame, which continues to be supported by the ascending trend line. We still believe that the pair will start falling in the next week or two, so we are waiting for the price to cross this line. However, till that day, we have to admit that the technical factors speak in favor of the pound's growth, though the fundamentals and macroeconomics do not always support the pound. On the 5-minute chart tomorrow, it is recommended to trade at the levels 1.1863-1.1877, 1.1950-1.1957, 1.1994, 1.2079, 1.2141, 1.2186-1.2205, 1.2245-1.2260, 1.2329-1.2337. As soon as the price passes 20 pips in the right direction, you should set a Stop Loss to breakeven. On Monday, there are no important events or reports in the UK or the US, so it will probably be a boring day for the pair.
Basic rules of the trading system:
1) The strength of the signal is determined by the time it took the signal to form (a rebound or a breakout of the level). The quicker it is formed, the stronger the signal is.
2) If two or more positions were opened near a certain level based on a false signal (which did not trigger a Take Profit or test the nearest target level), then all subsequent signals at this level should be ignored.
3) When trading flat, a pair can form multiple false signals or not form them at all. In any case, it is better to stop trading at the first sign of a flat movement.
4) Trades should be opened in the period between the start of the European session and the middle of the US trading hours when all positions must be closed manually.
5) You can trade using signals from the MACD indicator on the 30-minute time frame only amid strong volatility and a clear trend that should be confirmed by a trendline or a trend channel.
6) If two levels are located too close to each other (from 5 to 15 pips), they should be considered support and resistance levels.
On the chart:
Support and Resistance levels are the levels that serve as targets when buying or selling the pair. You can place Take Profit near these levels.
Red lines are channels or trend lines that display the current trend and show in which direction it is better to trade now.
The MACD indicator (14, 22, and 3) consists of a histogram and a signal line. When they cross, this is a signal to enter the market. It is recommended to use this indicator in combination with trend patterns (channels and trendlines).
Important announcements and economic reports that can be found on the economic calendar can seriously influence the trajectory of a currency pair. Therefore, at the time of their release, we recommend trading as carefully as possible or exiting the market in order to avoid sharp price fluctuations.
Beginners on Forex should remember that not every single trade has to be profitable. The development of a clear strategy and money management is the key to success in trading over a long period of time.


