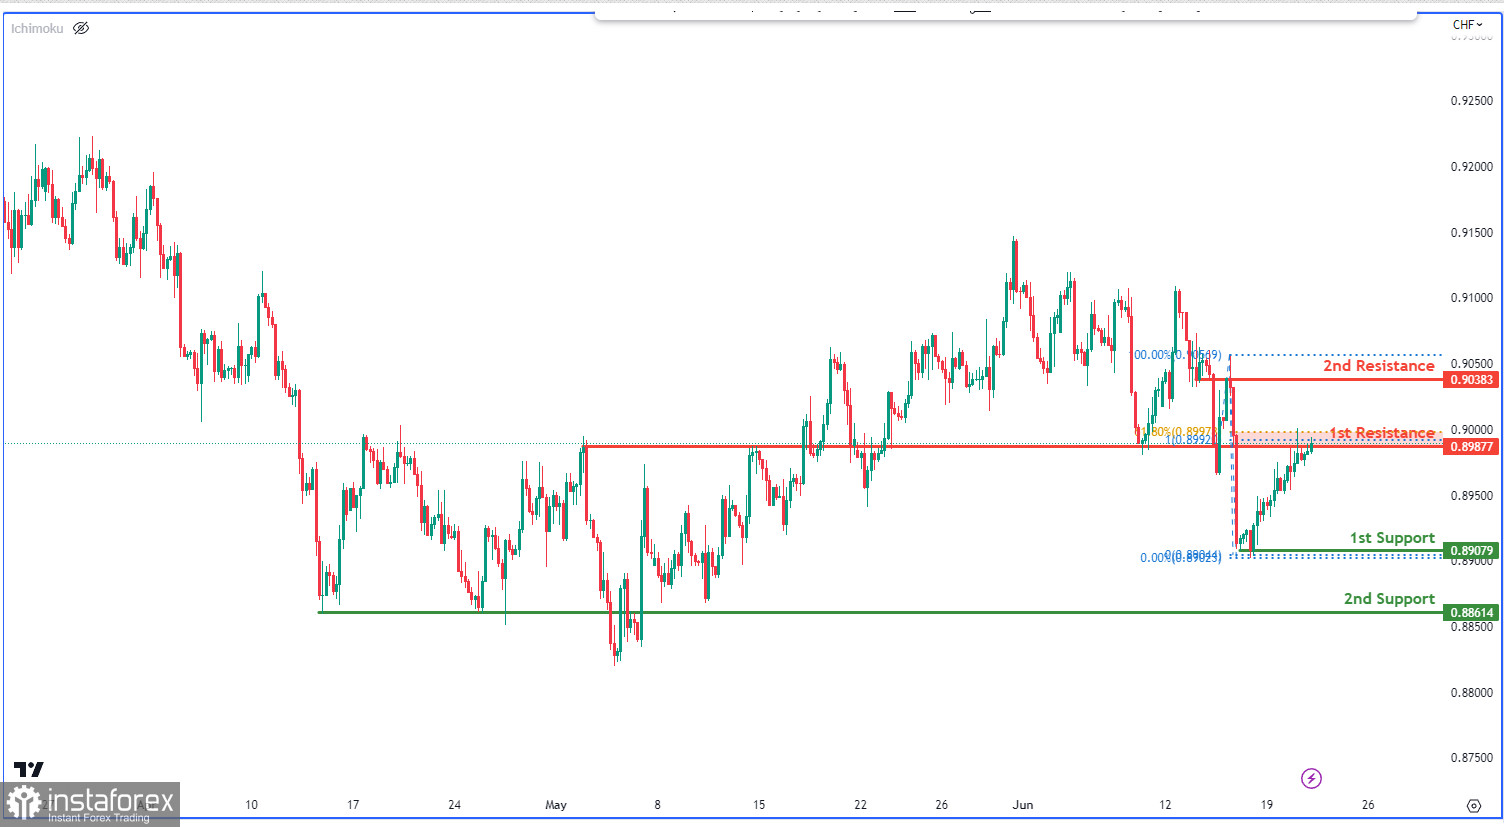
The USD/CHF chart shows a bearish trend, indicating a downward movement in the market.
The first resistance level at 0.8987, which is an overlap resistance, is significant. It aligns with the 61.80% Fibonacci Retracement and the 100% Fibonacci Projection, making it a crucial level to watch for a potential bearish reaction.
On the downside, the first support level at 0.8907 acts as a swing low support, attracting potential buying interest. Additionally, the second support level at 0.8861 serves as a pullback support, providing additional reinforcement to the price level.
Conversely, the second resistance level at 0.9038 acts as a pullback resistance, potentially exerting selling pressure on the price.


