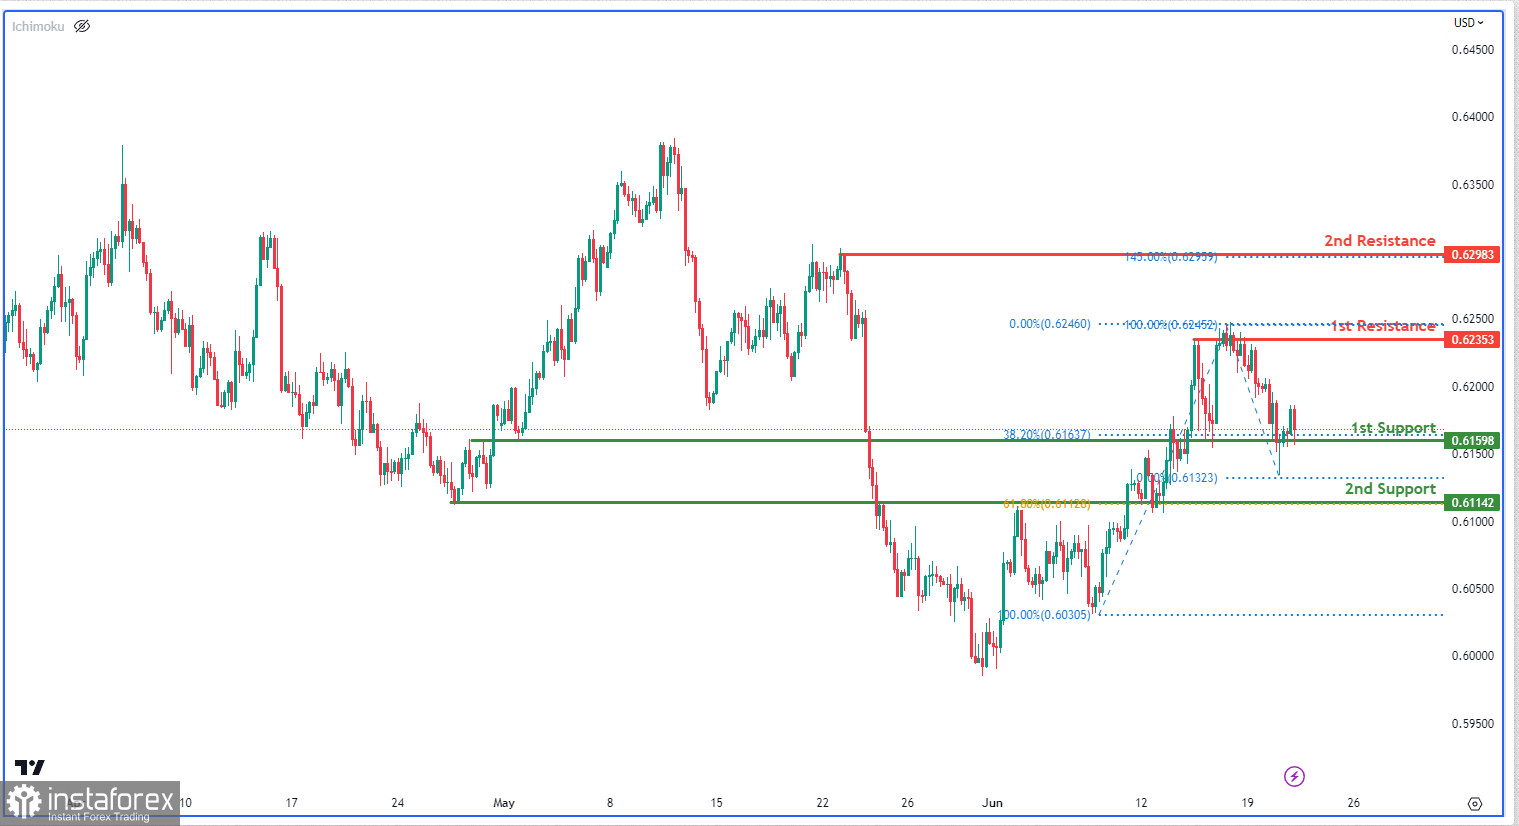
The NZD/USD chart shows a weak bullish momentum, with potential for a bounce off the first support level at 0.6160 and a move towards the first resistance level.
The support levels at 0.6160 and 0.6114 are significant as they align with Fibonacci retracement levels, providing additional support for potential upward movement.
On the upside, the resistance levels at 0.6235 and 0.6306 represent significant barriers, with 0.6306 also aligning with a Fibonacci extension level.


