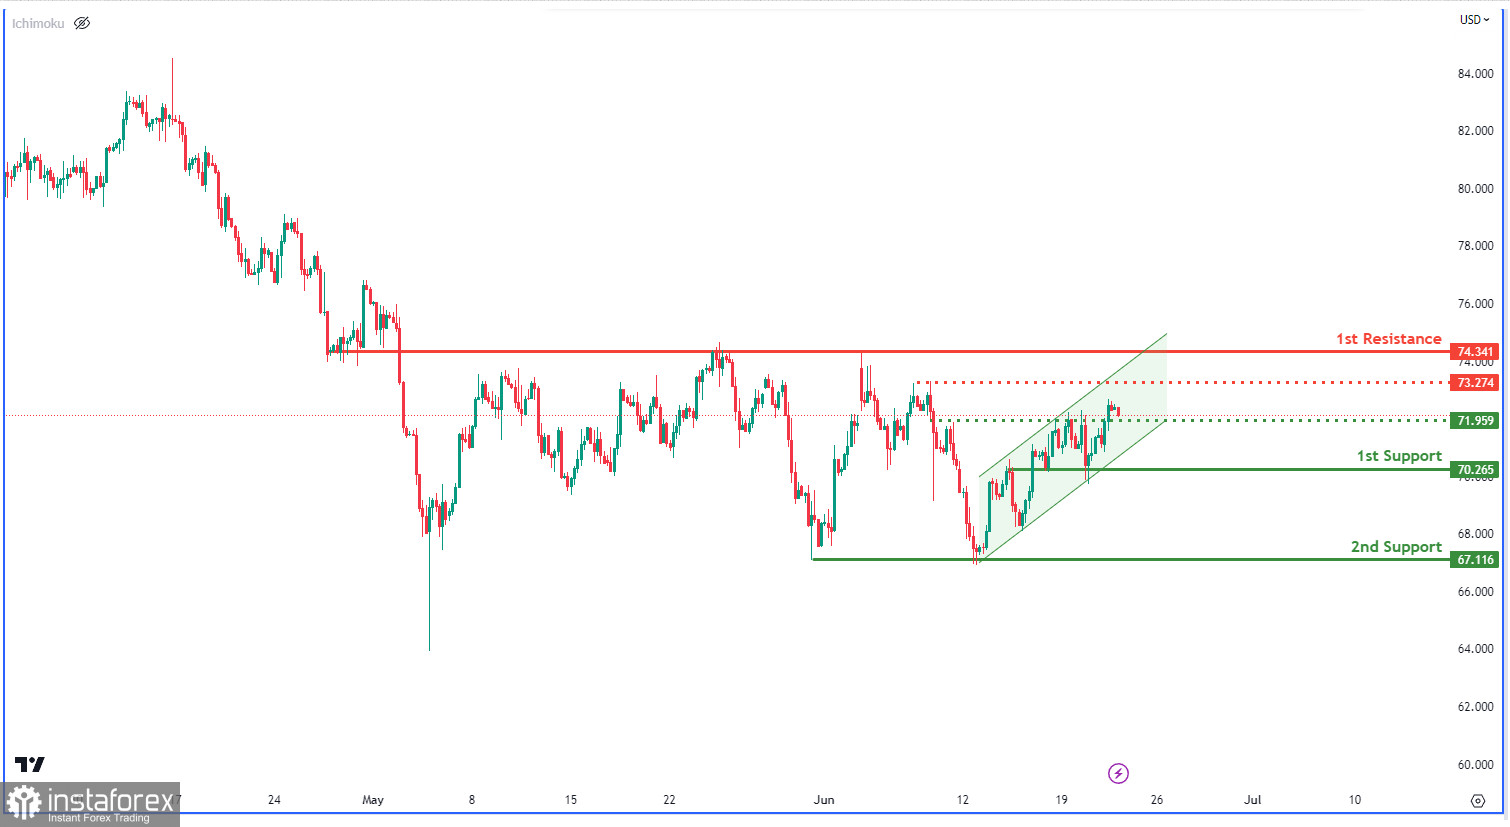
The WTI chart demonstrates a bullish momentum within an ascending channel, suggesting the possibility of further upward movement towards the first resistance at 74.34. The chart also indicates support levels at 70.26 (overlap support), 67.11 (multi-swing low support), and an intermediate level at 71.95 (pullback support). Additionally, there is an intermediate resistance at 73.27 acting as a swing high resistance.


