Main Quotes Calendar Forum
flag

FX.co ★ Technical analysis of gold

parent
Forex Analysis:::2022-11-29T12:01:42

Technical analysis of gold

#GOLD:

Technical analysis of gold

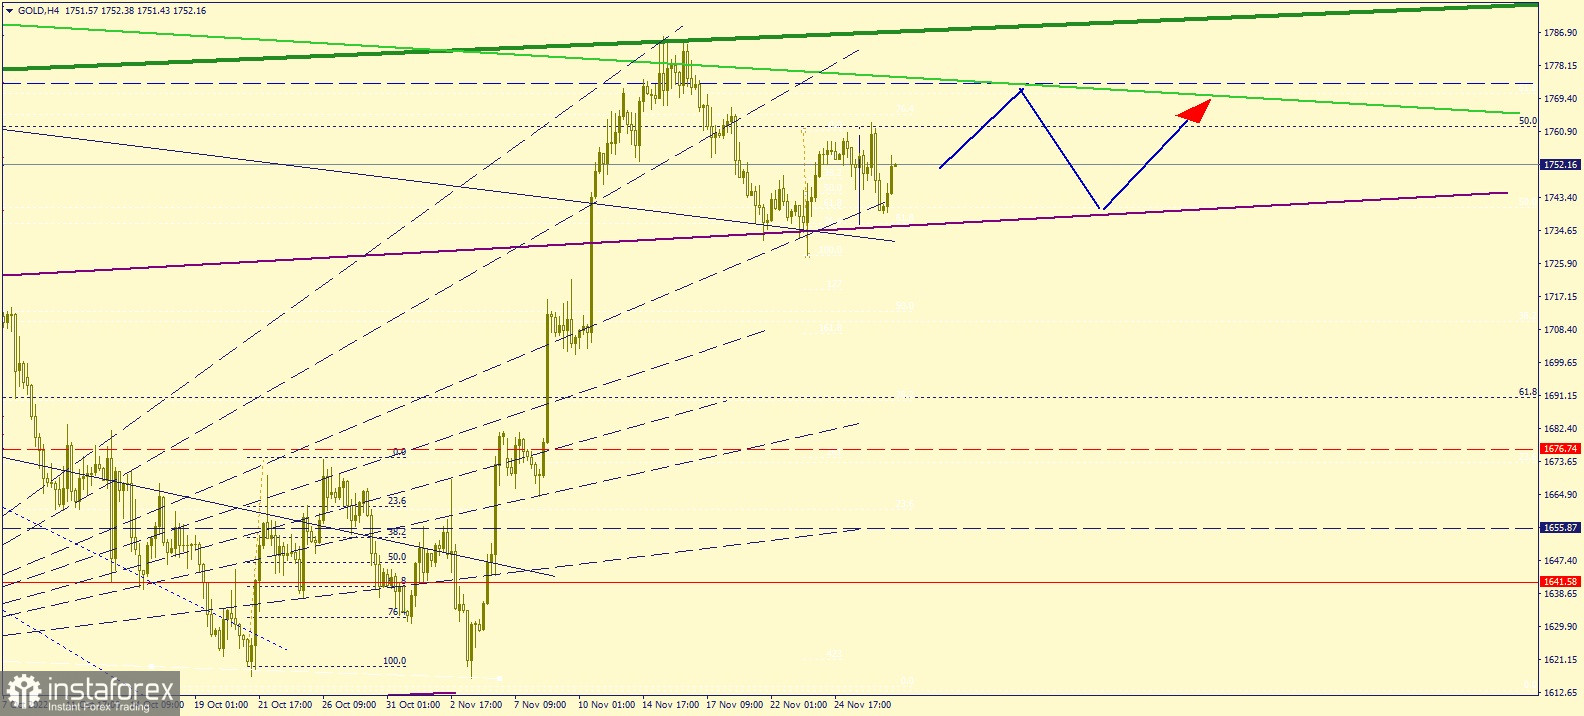
The chart shows the movement of gold on the 4-hour (H4) chart.

The metal reached the support level of $1733.0, then reversed towards $1775.0. There is a high chance that it will continue to trade sideways next week, as shown in the chart above.

Good luck!

Analyst InstaForex
Share this article:
parent
loader...
all-was_read__icon
You have watched all the best publications
presently.
We are already looking for something interesting for you...
all-was_read__star
Recently published:
loader...
More recent publications...