Economic calendar on November 28
The economic calendar was traditionally empty on Monday as no important reports were published either in the EU and UK or in the US.
Overview of technical charts on November 28
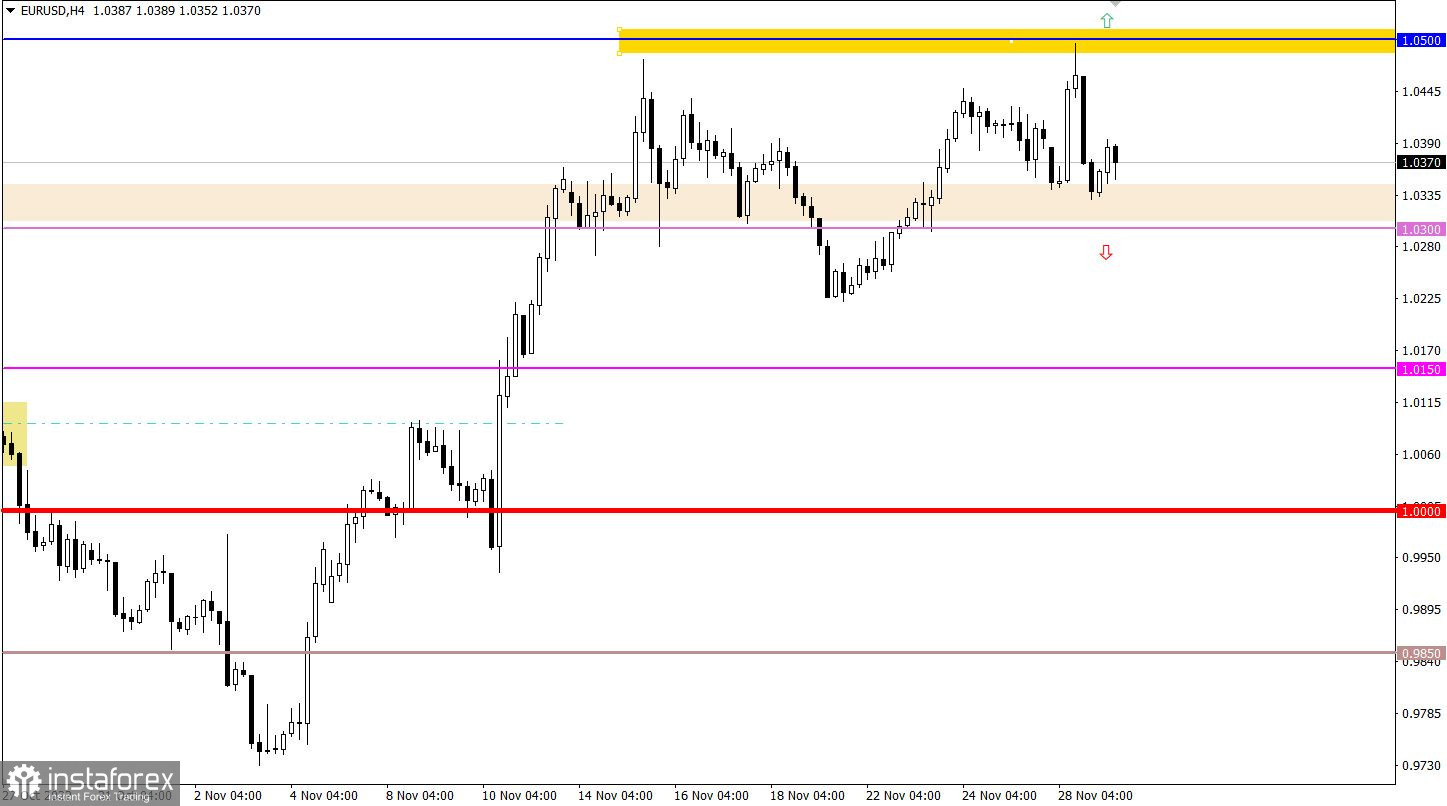
As a result of high speculative activity, EUR/USD touched the resistance level of 1.0500. However, the success of the buyers did not last long as the volume of short positions increased rapidly. So, the pair reversed to the downside.
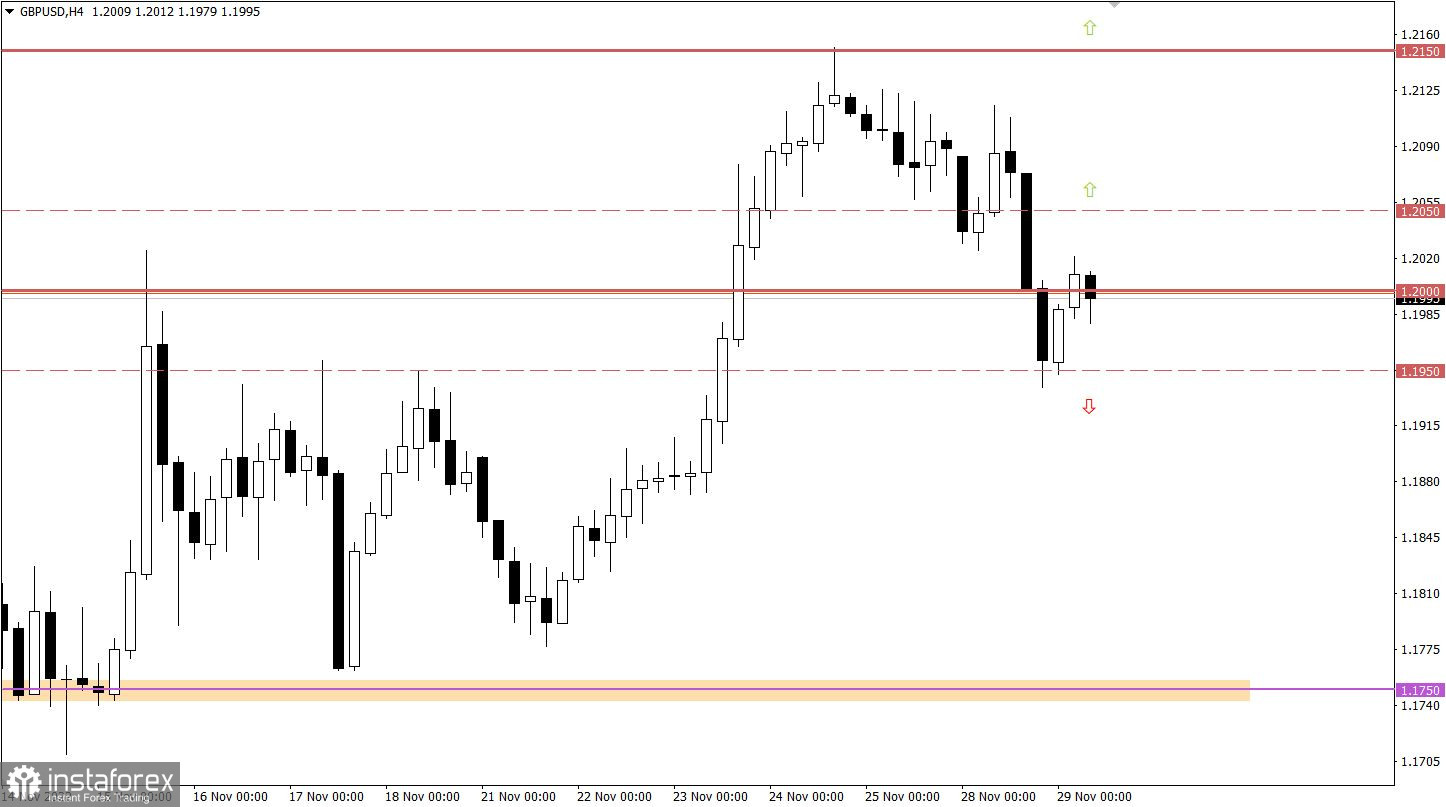
GBP/USD accelerated its decline after closely approaching the psychological level of 1.2000. Then traders accumulated more short positions so that the pair began a retracement. Notably, bears failed to hold below the key level of 1.1950. As a result, the price bounced off this level and moved above 1.2000.

Economic calendar on November 29
Today, traders may focus on the UK lending market which is projected to fall. The number of mortgage approvals may turn out to be 63K compared to 66.8 a month ago. The value of mortgage lending is predicted to be just 5.7 billion pounds versus 6.1 billion pounds recorded last year. This means that the UK lending market is declining and is dragging down the real estate market with it. The industrial sector is also suffering against this backdrop.
Therefore, the pound sterling may come under bearish pressure.
Timing
UK Mortgage Lending – 09:30 GMT
Trading plan for EUR/USD on November 29
At the moment, we can clearly observe market uncertainty. Therefore, the best strategy in this case would be to wait until the price settles beyond any of the mentioned levels.
Let's specify:
The upward scenario will be relevant if the quote settles above 1.0500 on the 4-hour chart.
The downward scenario will be activated if the price settles firmly below 1.0300 on the 4-hour chart.

Trading plan for GBP/USD on November 29
In this situation, if the price settles firmly below 1.1950, this will serve as a technical signal for an extended downtrend. If so, the pound may easily drop to the level of 1.1750.
As for the upward scenario, the quote needs to return to the area of 1.2150 to activate the uptrend. This price move is very likely to lead the pair to the local high.

What's on the chart
The candlestick chart type is white and black graphic rectangles with lines above and below. With a detailed analysis of each individual candle, you can see its characteristics relative to a particular time frame: opening price, closing price, intraday high and low.
Horizontal levels are price coordinates, relative to which a price may stop or reverse its trajectory. In the market, these levels are called support and resistance.
Circles and rectangles are highlighted examples where the price reversed in history. This color highlighting indicates horizontal lines that may put pressure on the asset's price in the future.
The up/down arrows are landmarks of the possible price direction in the future.


