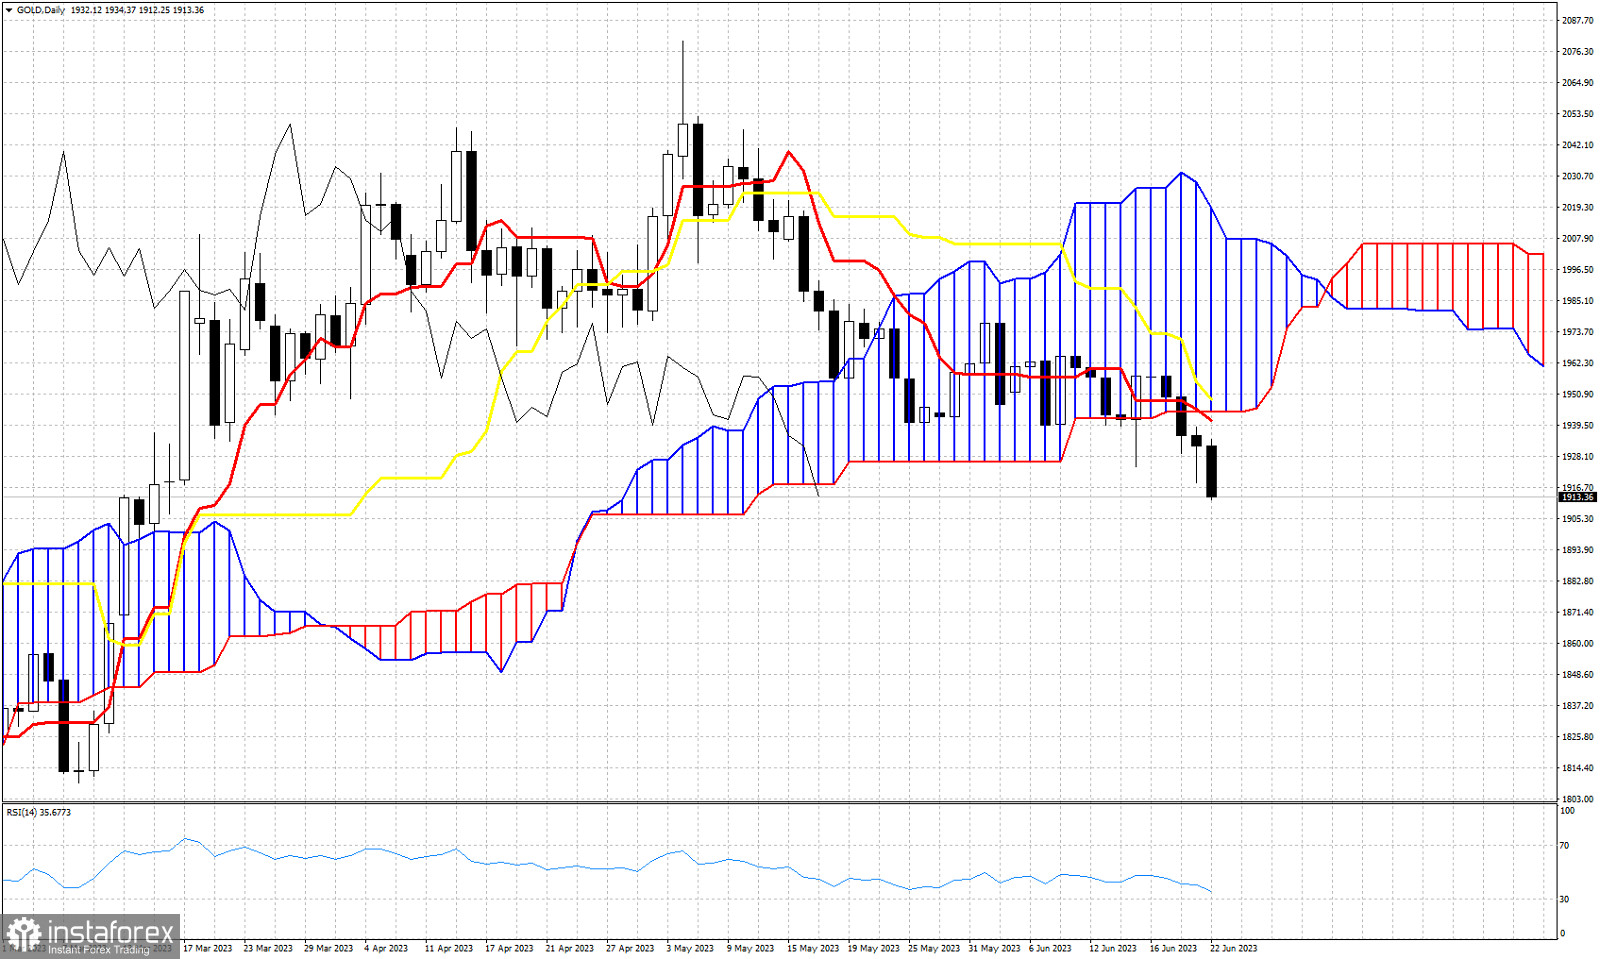
Gold price is trading around $1,913. Gold trend is bearish in the daily chart according to the Ichimoku cloud indicator. This bearish signal was given on Tuesday June 20th when the daily close was below the Kumo (cloud). In previous posts we warned that Gold price was vulnerable to a move lower as bulls were unable to recapture the tenkan-sen (red line indicator). The tenkan-sen provides resistance at $1,941. The lower cloud boundary is at $1,944 while the kijun-sen (yellow line indicator) provides key resistance also at $1,949. The $1,941-49 area is important resistance for Gold and if traders want to see a trend change, price must first break above this area. The Chikou span (black line indicator) remains in a bearish trend as it is still positioned below the candlestick pattern. Bears remain in control according to the Ichimoku cloud indicator. So far there is no sign of a reversal.


