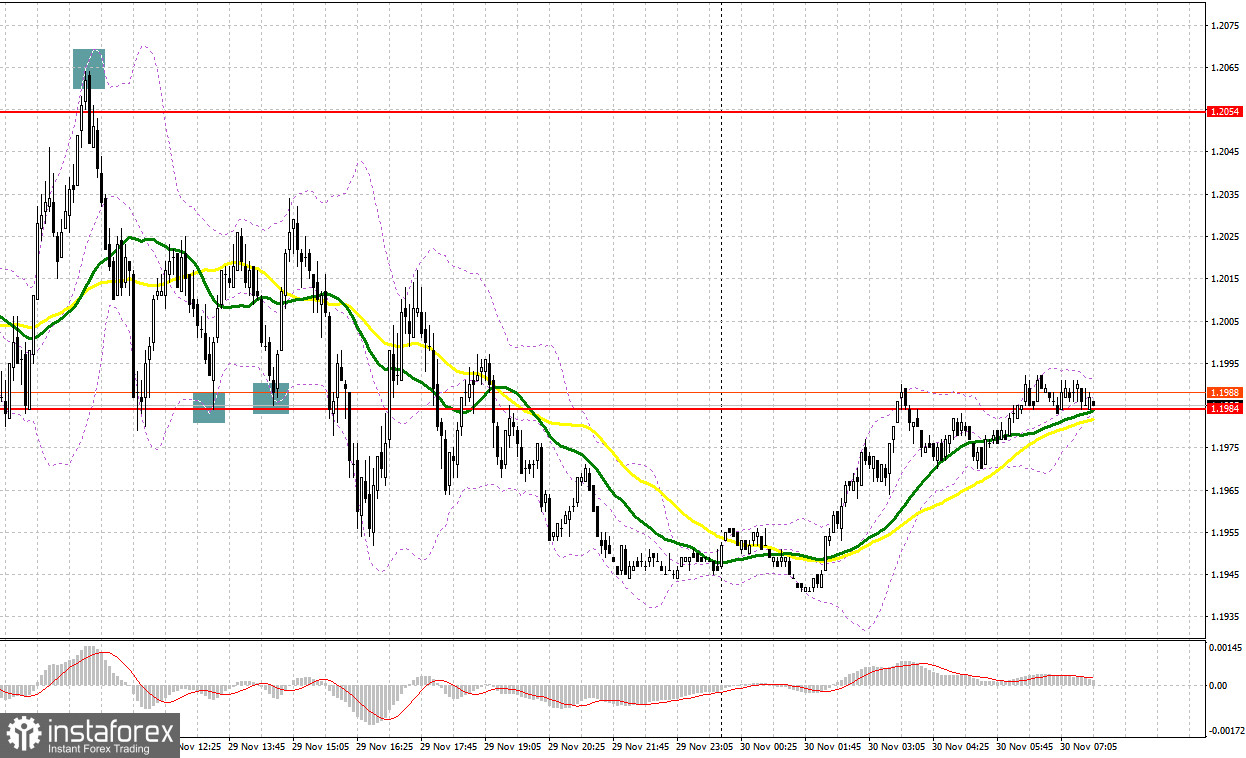
Yesterday, traders received several signals to enter the market. Let us take a look at the 5-minute chart to clear up the market situation. Earlier, I asked you to pay attention to the levels of 1.2018 and 1.2063 to decide when to enter the market. A rise and a breakout of 1.2018 as well as a downward test of this level formed a perfect entry point in long positions. This allowed the pound sterling to jump by 40 pips to 1.2063. Sellers benefited from the situation, whereas a false breakout of 1.2064 gave a perfect sell signal. As a result, the pair lost about 70 pips. In the second part of the day, bulls several times protected the support level of 1.1984, every time forming a false breakout and a buy signal. The upward movement totaled 30-40 pips.

Conditions for opening long positions on GBP/USD:
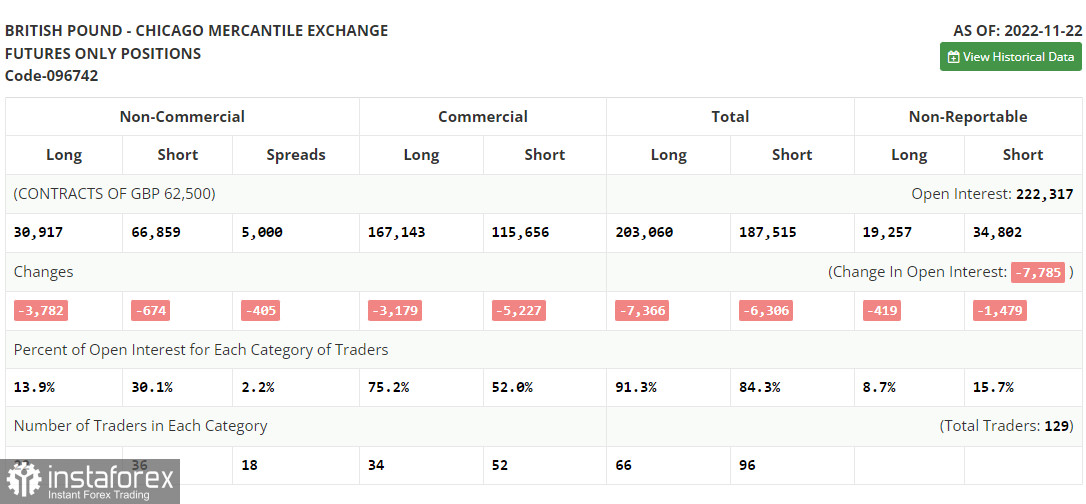
Let us first focus on the futures market. According to the COT report from November 22, the number of both long and short positions dropped. Lower activity in the UK economy points to the approaching recession. However, the Bank of England is unlikely to take measures to cope with the recession. First of all, it needs the settle the issue of high inflation. According to recent data, it continues to grow. Against the backdrop, traders prefer to remain cautious and avoid trading the pound sterling. This week, a representative of the Fed will share his view on the monetary policy for the next year. If the tone of his announcements fails to meet traders' expectations, pressure on the British pound will jump, thus causing a new wave of sell-offs. The recent COT report unveiled that the number of long non-commercial positions declined by 3,782 to 30,917, while the number of short non-commercial positions dropped by 674 to 66,859. This led to an increase in the negative value of the non-commercial net position to -35,942 compared to -32,834 a week earlier. The weekly closing price rose to 1.1892 from 1.1885.

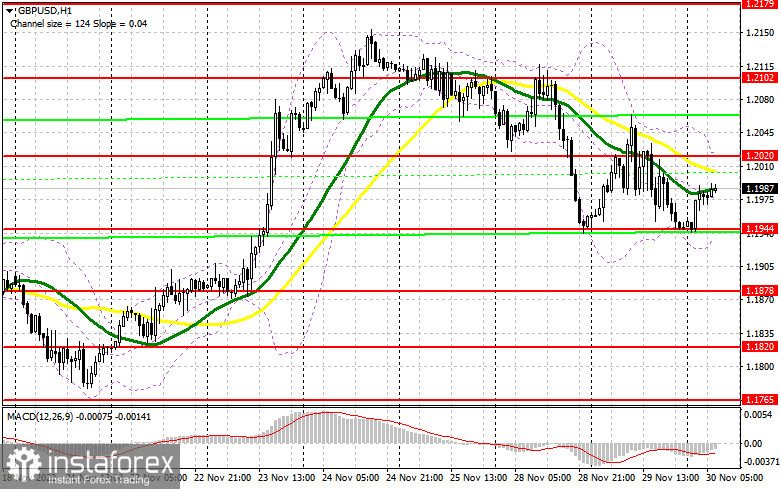
Today, the UK will not publish any information that will allow buyers to benefit from the situation and alter the downward cycle. That is why traders are likely to become active only during the US trade. During the European session, the UK will publish its house price index, while the BoE MPC member Pill will provide a speech. To revive the upward cycle, bulls should protect the nearest support level of 1.1944. A false breakout of this level and good data from the UK may form a buy signal with the target at 1.2020. The pair failed to exceed this level yesterday. At this level, we may also see sellers' MAs, which will cap the pair's upward potential. If bulls fail to protect this level, the pair will hardly form an upward trend. The pair will continue gaining in value only if it consolidates above 1.2020. Meanwhile, a breakout of this level and a downward test will allow the price to climb to 1.2102, where buyers will find it difficult to control the market. The farthest target is located at 1.2179, where it is recommended to lock in profits. If the pound/dollar pair declines and buyers fail to protect 1.1944, pressure on the pound sterling will return. In the event of this, traders should avoid long positions until the price hits 1.1878. There, it is possible to open long positions only after a false breakout. Traders may also go long just after a bounce off 1.1820 or from the low of 1.1765, expecting a rise of 30-35 pips.
Conditions for opening short positions on GBP/USD:
Bears continue to control the market and now, a lot will depend on the US macroeconomic reports and Jerome Powell's comments. Bears could become more confident if the price breaks the nearest support level of 1.1944. However, they should also protect 1.2020. If the pound/dollar pair increases amid strong data from the UK, only a false breakout of 1.2020 will give a sell signal with the target at the nearest support level of 1.1944. Notably, the price tested this level three times in recent days. That is why it is highly likely to break it. A breakout and an upward test of this level will give a sell signal with the target at the low of 1.1878. This will intensify pressure on the pound sterling. The next target is located at 1.1820, where it is recommended to lock in profits. A test of 1.1820 will seriously affect buyers' positions. This is how a new bearish trend may begin. If the pound/dollar pair increases and bears fail to protect 1.2020, bulls will regain control over the market. In this light, the pound/dollar pair will rise to the high of 1.2102. A false breakout of this level will form a sell signal. If bears fail to protect this level, the pair will jump to 1.2179. There, traders should sell the asset just after a rebound, expecting a rise of 30-35 pips.

Signals of indicators:
Moving Averages
Trading is performed below 30- and 50-day moving averages, which reflects significant pressure on the pair.
Note: The period and prices of moving averages are considered by the author on the one-hour chart which differs from the general definition of the classic daily moving averages on the daily chart.
Bollinger Bands
If the British pound breaks the upper limit of the indicator located at 1.2020, it will resume gaining in value. If it breaks the lower limit of 1.1940, pressure on the pair will increase.
Description of indicators
- Moving average (moving average, determines the current trend by smoothing volatility and noise). The period is 50. It is marked in yellow on the chart.
- Moving average (moving average, determines the current trend by smoothing volatility and noise). The period is 30. It is marked in green on the graph.
- MACD indicator (Moving Average Convergence/Divergence - convergence/divergence of moving averages). A fast EMA period is 12. A slow EMA period is 26. The SMA period is 9.
- Bollinger Bands. The period is 20.
- Non-profit speculative traders are individual traders, hedge funds, and large institutions that use the futures market for speculative purposes and meet certain requirements.
- Long non-commercial positions are the total number of long positions opened by non-commercial traders.
- Short non-commercial positions are the total number of short positions opened by non-commercial traders.
- The total non-commercial net position is a difference in the number of short and long positions opened by non-commercial traders.


