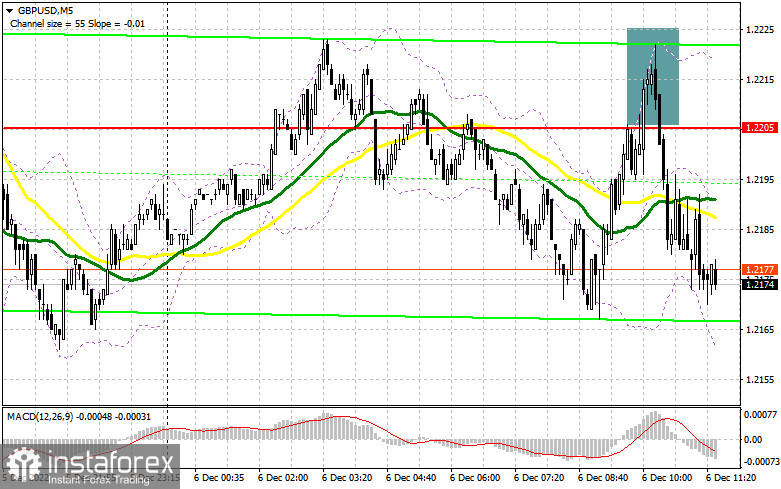
In my morning review, I mentioned the level of 1.2205 and recommended entering the market from there. Let's see what happened on the 5-minute chart. A rise to the level of 1.2205 and its false breakout allowed traders to add more short positions on the pair in line with the ongoing downtrend initiated yesterday. At the time of writing, the pair has dropped by 30 pips and continues to slide. From the technical viewpoint, the situation has changed although the main scenario remains the same.

For long positions on GBP/USD:
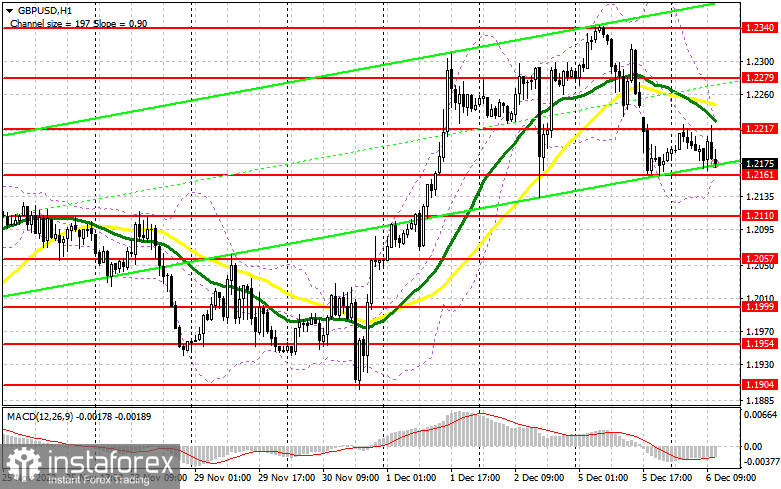
The empty economic calendar for the UK on Tuesday has probably ruined the plans of the bulls who failed to settle above 1.2205. In the afternoon, I see no important events that can potentially support the pound. So, at the moment, there are no conditions for buying the sterling. As the market is looking for more clues regarding the next rate hike in the US, especially amid the fresh fundamental data, traders are not willing to buy the pound at the current highs. Today's report on the trade balance is of little interest to forex traders. Therefore, the pair is likely to drop further. In this scenario, it would be reasonable to follow my recommendations outlined in the morning review. A false breakout at 1.2161 will create a good entry point into long positions with a prospect of a rise toward 1.2217 where moving averages are supporting the sellers. A breakout of this range and its downward retest will help buyers recover. It may also create an excellent buying opportunity at 1.2279. A new monthly high of 1.2340 will act as the most distant target where I recommend profit taking. If bulls fail to push the pair to 1.2161, which is more likely, bears will put pressure on the pair and may send it to new lows. In this case, it would be better to open long positions at the support level of 1.2110. Buying GBP/USD immediately after a rebound should be down only from 1.2057 or 1.1999, bearing in mind an intraday correction of 30-35 pips.
For short positions on GBP/USD:
Bears have already asserted their strength. As long as they keep the price below 1.2217, the pair is likely to fall further. I bet on a deeper decline of the pair even though we have no important reports coming from the US today. This is actually good for traders as they can be more focused on the current situation. It is crucial for sellers to close the day below the level of 1.2161. A retest of the low from December 5 will indicate that a new bearish cycle is being formed. But bears will also need to protect the resistance level of 1.2217. Only a false breakout similar to that discussed above will give an excellent entry point into short positions with a prospect of a decline to 1.2161. Its breakout and an upward retest will generate another good sell signal. If so, the price may head downwards to 1.2110 where bears may face strong resistance. The level of 1.2057 will serve as the furthest target where I recommend profit taking. If the pair does not move below 1.2217, bulls will try to regain control, thus pushing the pair up to the level of 1.2279. A false breakout at this level will create another entry point for going short with a possible continuation of a decline. If bears show no activity at this level, it is better to sell GBP/USD immediately after a rebound from 1.2340, keeping in mind a possible intraday correction of 30-35 pips.

COT report
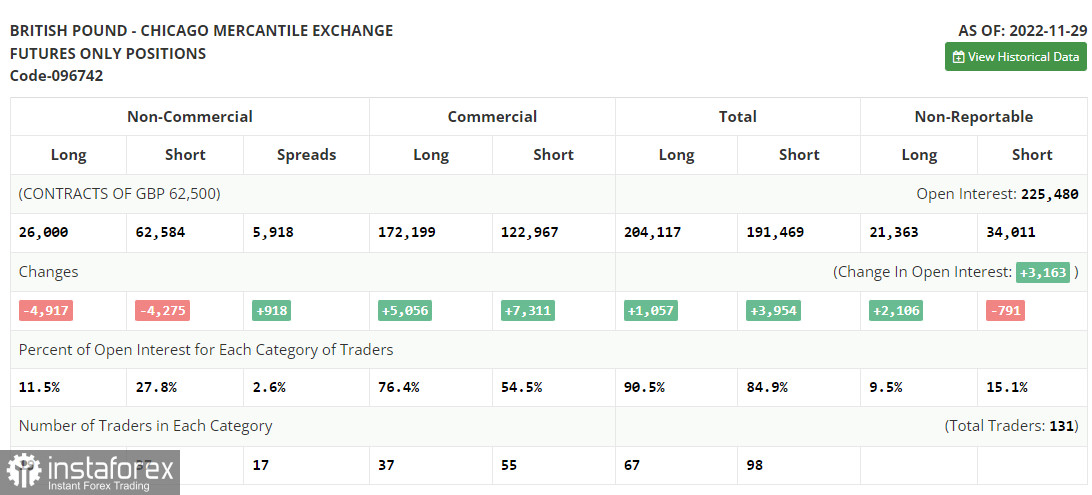
The Commitments of Traders (COT) report for November 29 showed a continued decrease in both short and long positions. Apparently, the recent macroeconomic data from the UK has dampened market optimism. A contraction in manufacturing and services activity indicates that the British economy is gradually sliding into a recession. The Bank of England prefers to ignore this fact as its top priority is to tame soaring inflation. According to the latest reports, inflation in the UK continues to accelerate. This is why It is hardly surprising that traders prefer to stay out of the market as they are not sure whether to buy or sell the pound. Given that the pair has strongly advanced since November this year, it is not advisable to open long positions at the current highs. Moreover, the US dollar is very likely to recover next week after the Fed's policy meeting and amid the strong performance of the US economy. The latest COT report revealed that long positions of the non-commercial group of traders decreased by 197 to 26,000 while short positions dropped by 4,275 to 62,584. This led to an increase in the negative value of the non-commercial net position to -36,584 versus -35,942 a week ago. The weekly closing price went up to 1.1958 from 1.1892.

Indicator signals:
Moving Averages
Trading below the 30- and 50-day moving averages indicates an upcoming downward correction.
Please note that the time period and levels of the moving averages are analyzed only for the H1 chart, which differs from the general definition of the classic daily moving averages on the D1 chart.
Bollinger Bands
In case of a decline, the lower band of the indicator at 1.2160 will serve as support.
Description of indicators:
• A moving average of a 50-day period determines the current trend by smoothing volatility and noise; marked in yellow on the chart;
• A moving average of a 30-day period determines the current trend by smoothing volatility and noise; marked in green on the chart;
• MACD Indicator (Moving Average Convergence/Divergence) Fast EMA with a 12-day period; Slow EMA with a 26-day period. SMA with a 9-day period;
• Bollinger Bands: 20-day period;
• Non-commercial traders are speculators such as individual traders, hedge funds, and large institutions who use the futures market for speculative purposes and meet certain requirements;
• Long non-commercial positions represent the total number of long positions opened by non-commercial traders;
• Short non-commercial positions represent the total number of short positions opened by non-commercial traders;
• The non-commercial net position is the difference between short and long positions of non-commercial traders.


