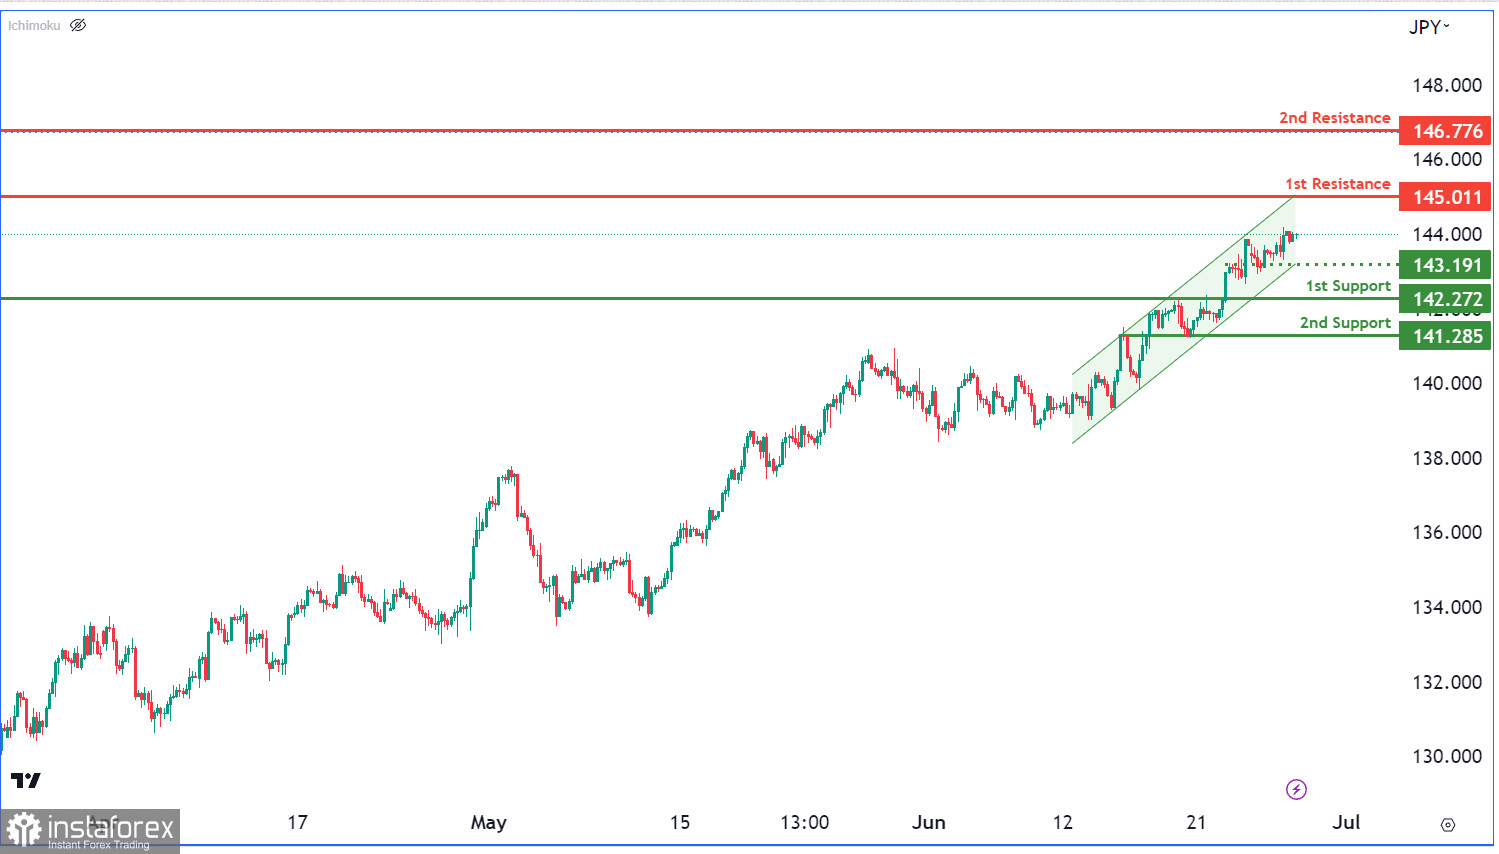
The USD/JPY chart shows a bullish momentum within an ascending channel, indicating potential upward movement. Traders should consider a possible continuation of the bullish trend towards the 1st resistance level at 145.01, which acts as a pullback resistance. Additionally, the 2nd resistance level at 146.77, coinciding with the 78.60% Fibonacci Retracement, reinforces its significance.
For downside movement, the 1st support level at 142.27 provides potential support as a pullback support. The 2nd support level at 141.28, an overlap support aligned with the 78.60% Fibonacci Projection, further strengthens its importance. An intermediate support level at 143.19 also holds significance as an overlap support.


