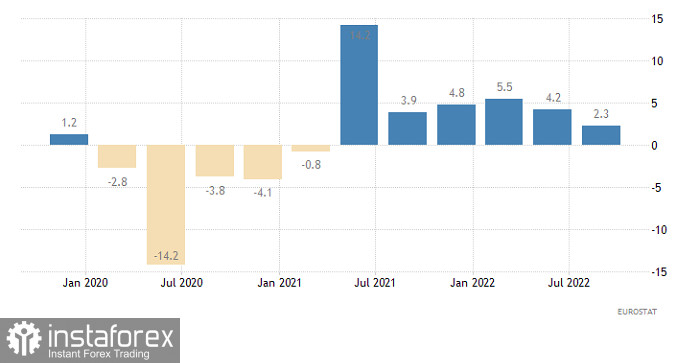
The third estimate of the EU GDP for Q3 2022 stands at a slightly higher level than the first two estimates. The EU economic output slowed down its annual growth to 2.3% from 4.2% in Q2 2022. The previous estimates suggested a decline to 2.1% on year. However, the EU GDP for Q2 2022 was downgraded to 4.2% from the unrevised 4.3% which muted the overall positive sentiment. No wonder, the single European currency asserted its strength for obvious reasons. In fact, the GDP went down to a slightly less degree, so the reading is an uptick higher than in the previous estimates. Nevertheless, economic growth in the Eurozone has been shrinking.
EUR Gross Domestic Product, y/y

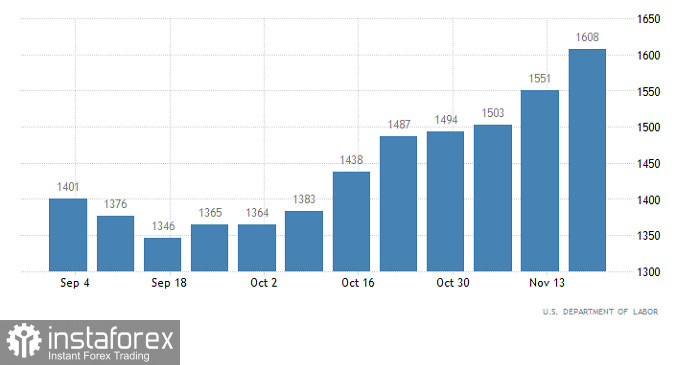
At the same time, things are not so smooth in the US. For example, the situation in the labor market has been getting worse for two months in a row. Today the data on unemployment claims are likely to print a higher figure. The number of first-time jobless claims could have increased by 15,000. The number of continuing unemployment claims, which are given top priority, has been growing for 8 weeks straight. The data today might log an increase for the ninth time. Certainly, this does not add to the US dollar's confidence. The thing is that the greenback is still strongly oversold. So, its minor downward correction is imminent.
US Continuing Unemployment Claims

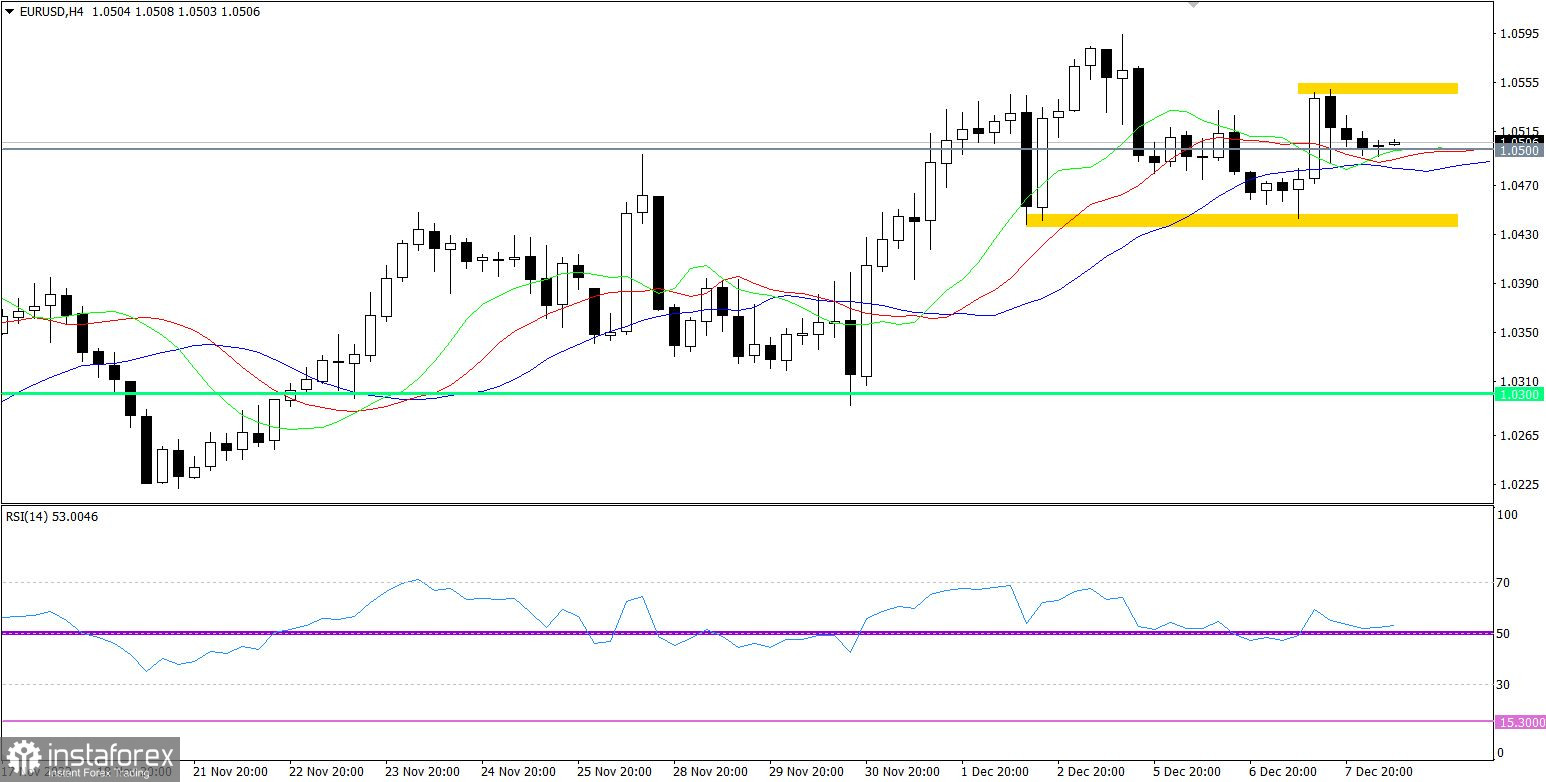
After a brief period of sideways trading below 1.1500, EUR/USD resumed its growth. As a result, the market saw an intraday surge of long positions. This enables an opposite move above 1.0500.
The H4 RSI is moving in the upper area of the indicator which proves the overall traders' interest in long positions.
Due to the recent retracement, H4 Alligator is not generating a clear-cut technical signal. Moving averages (MA) are intersected with one another. D1 Alligator neglects intraday price moves. Moving averages are pointed upwards which corresponds to the ascending cycle.

Outlook and trading scenario
Under such market conditions, I'm focused on two levels: 1.0550 which is yesterday's high and 1.1430 which is interim support. If the price settles beyond any of these levels in the 4-hour chart, it would follow that particular direction. Until then, the instrument is set to trade sideways within the above-said borders.
Complex indicator analysis provides a mixed signal for short-term and intraday trading. Technical indicators suggest an ascending cycle in the medium term.


