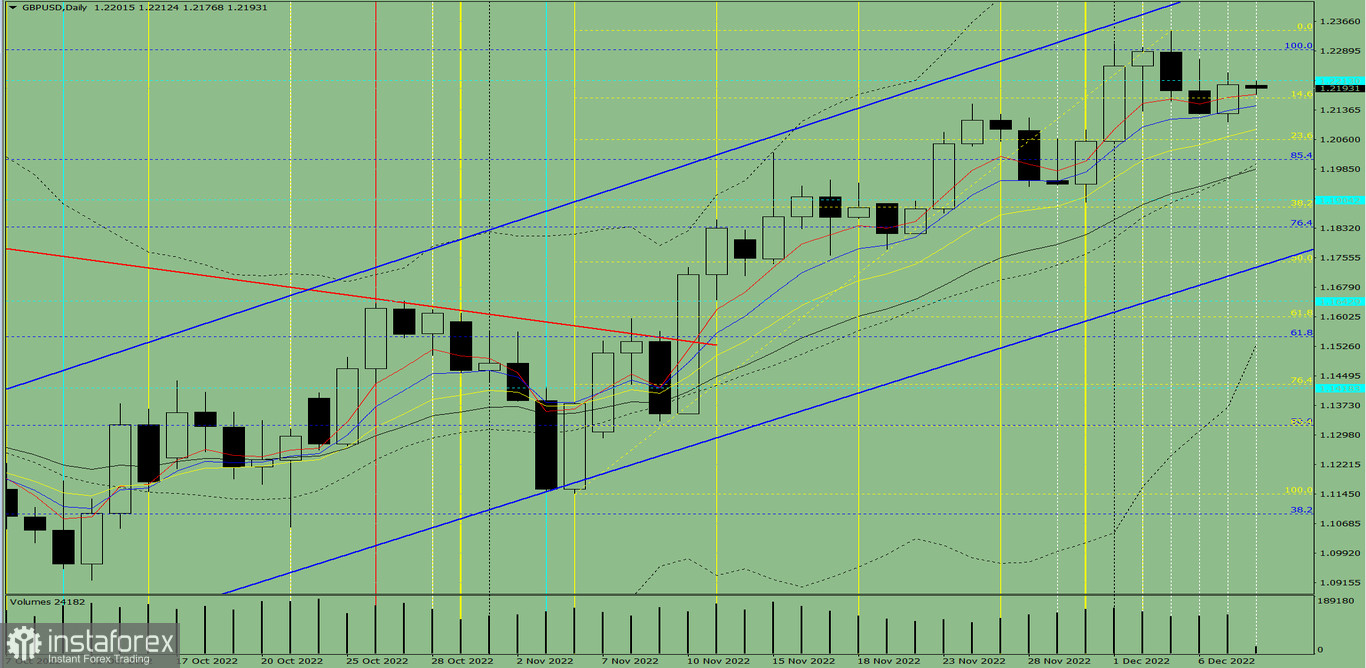
Trend analysis (fig. 1).
Today, the pair declined to the target level of 1.2148 – 8 average EMA (blue thin line) from 1.2202 (the closing of yesterday's daily candlestick). When testing this level, the instrument may continue its upward movement to 1.2343 – the upper fractal (yellow dotted line).

Fig. 1 (daily chart).
Complex analysis:
- indicator analysis– up;
- Fibonacci levels – down;
- trading volumes – down;
- candlestick analysis – up;
- trend analysis – up;
- Bollinger lines – up;
- weekly chart-up.
Conclusion:
Today, the pair declined to the target level of 1.2148 - 8 average EMA (blue thin line) from 1.2202 (the closing of yesterday's daily candlestick). When testing this level, the instrument may continue its upward movement to 1.2343 – the upper fractal (yellow dotted line).
Alternatively, the price could fall to 1.2087 – 13 average EMA (yellow thin line) from 1.2202 (the closing of yesterday's daily candle). When testing this level, it may grow to 1.2343 – the upper fractal (yellow dotted line).


