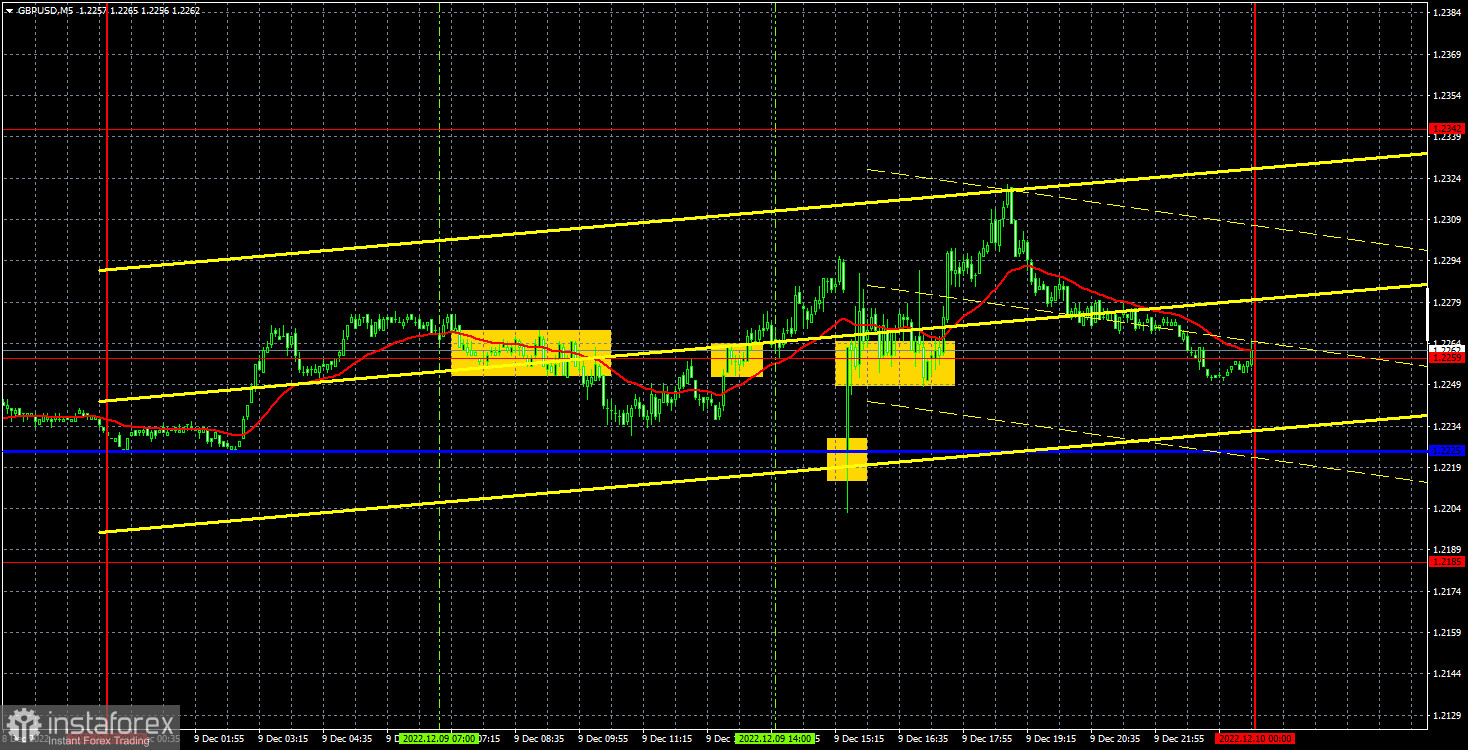
M5 chart of GBP/USD

GBP/USD found grounds for its growth on Friday. Despite the fact that there were no UK reports on that day and US reports were rather supportive for the USD, GBP still managed to grow by the end of the day. Anyway, we are not even surprised with such a state of affairs, the pound has been rising practically without correcting for the past weeks and months. Of course, there are corrections on the one-hour chart and they are visible, but when switching to a 24-hour chart or even a 4-hour one there were no pullbacks or even if there were, they turn out to be very weak. Thus, the new trading week will have to dot all the i's. Or else the pound will continue rising for no reason, or maybe the highly anticipated and strong bearish correction might actually begin.
Speaking of trading signals, everything was quite messy. The first two trading signals near 1.2259 were false, and the price was only able to go the necessary 20 points in the right direction in the second case, so as to be able to set the Stop Loss to Breakeven. Therefore, you could lose on the first trade. The next step was a sudden collapse, provoked unexpectedly by the US producer price index, the price went down to the critical line and bounced from it, creating a buy signal. But it was possible to use it only after the price crossed 1.2259, which was the third signal near this level, while the first two were false. Consequently, it should not have been triggered.
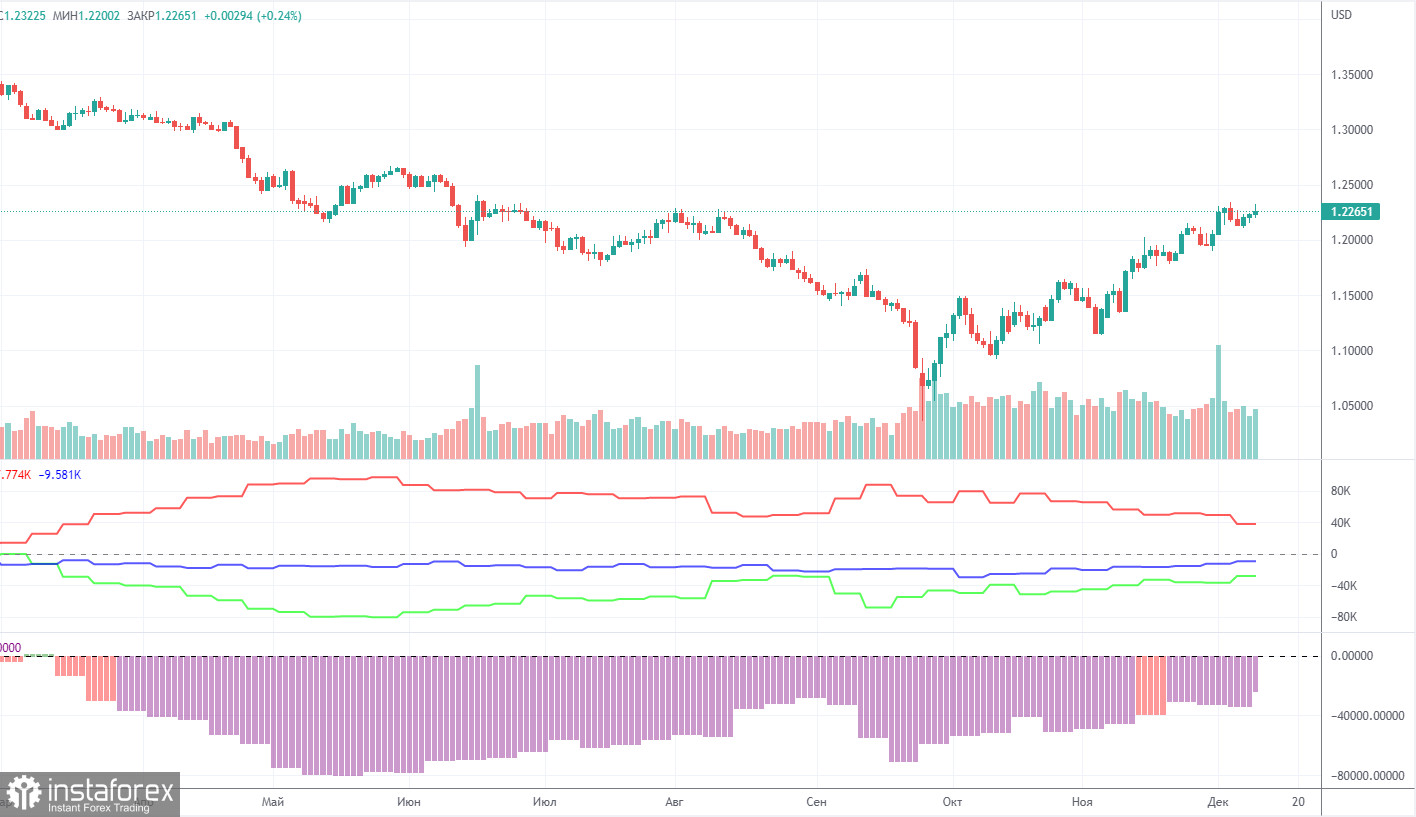
COT report

The latest COT report on the British pound showed that the bearish mood is weakening. During the reporting week, non-commercial traders opened 1,700 long positions and closed 7,800 short ones. The net position increased by almost 10,000. The net position dropped by 1,000. The figure has been on the rise for several months. Nevertheless, sentiment remains bearish, and the pound is on the rise against the greenback for no reason. We assume that the pair may well resume the downtrend soon. Notably, both GBP/USD and EUR/USD now show practically identical movement. At the same time, the net position on EUR/USD is positive and negative on GBP/USD. Non-commercial traders now hold 54,000 sell positions and 30,000 long ones. The gap between them is quite wide. As for the total number of open longs and shorts, the bulls have an advantage here by 10,000. Technical factors indicate that the pound may move in an uptrend in the long term. At the same time, fundamental and geopolitical factors signal that the currency is unlikely to strengthen significantly.
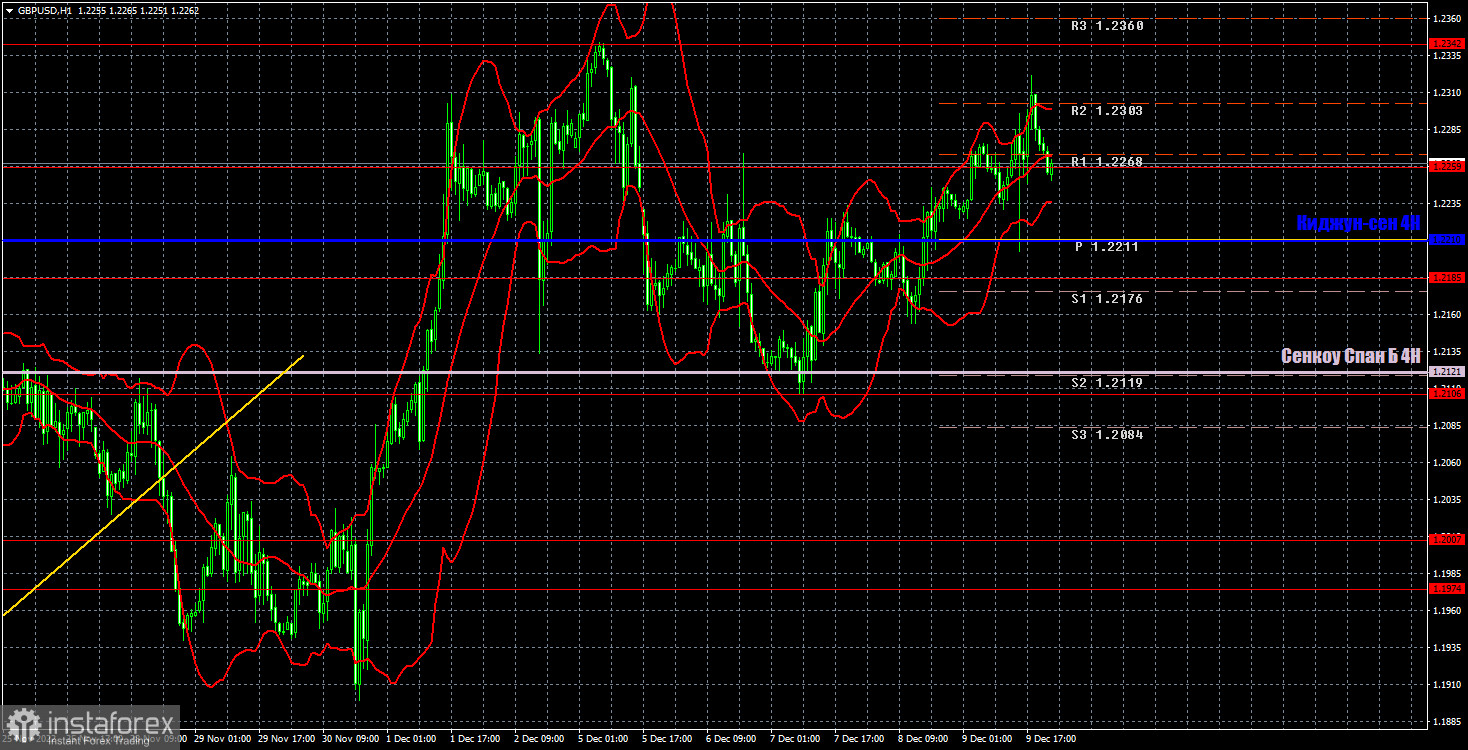
H1 chart of GBP/USD

GBP/USD keeps trading noticeably higher on the one-hour chart, but still trying to maintain a corrective mood. This week everything will depend on the macro data and the meetings of several central banks, so movements may be sharp and could be in any direction. We should brace for it. On Monday, the pair may trade at the following levels: 1.1874, 1.1974-1.2007, 1.2106, 1.2185, 1.2259, 1.2342, 1.2429-1.2458. The Senkou Span B (1.2121) and Kijun Sen (1.2210) lines may also generate signals. Pullbacks and breakouts through these lines may produce signals as well. A Stop Loss order should be set at the breakeven point after the price passes 20 pips in the right direction. Ichimoku indicator lines may move during the day, which should be taken into account when determining trading signals. In addition, the chart does illustrate support and resistance levels, which could be used to lock in profits. Today, GDP (not quarterly) and industrial production reports will be released in the UK. Most likely, they will provoke a small reaction from the market, but this week there will be much more important events, and right from the start, the market may already try to work them out.
What we see on the trading charts:
Price levels of support and resistance are thick red lines, near which the movement may end. They do not provide trading signals.
The Kijun-sen and Senkou Span B lines are the lines of the Ichimoku indicator, moved to the one-hour chart from the 4-hour one. They are strong lines.
Extreme levels are thin red lines from which the price bounced earlier. They provide trading signals.
Yellow lines are trend lines, trend channels, and any other technical patterns.
Indicator 1 on the COT charts reflects the net position size of each category of traders.
Indicator 2 on the COT charts reflects the net position size for the non-commercial group.


