


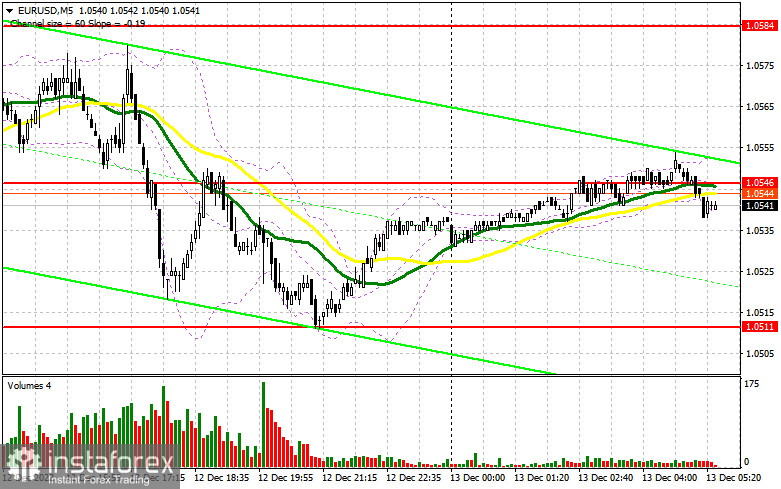
Yesterday, the pair formed only one entry signal. Let's see what happened on the 5-minute chart. In my morning review, I mentioned the level of 1.0536 and recommended entering the market from there. A breakout of this level was not followed by a downward retest which is why we couldn't get a good entry point into long positions. Although the technical outlook changed for the second half of the day, no new signals were formed due to low volatility and the lack of information background.
For long positions on EUR/USD:
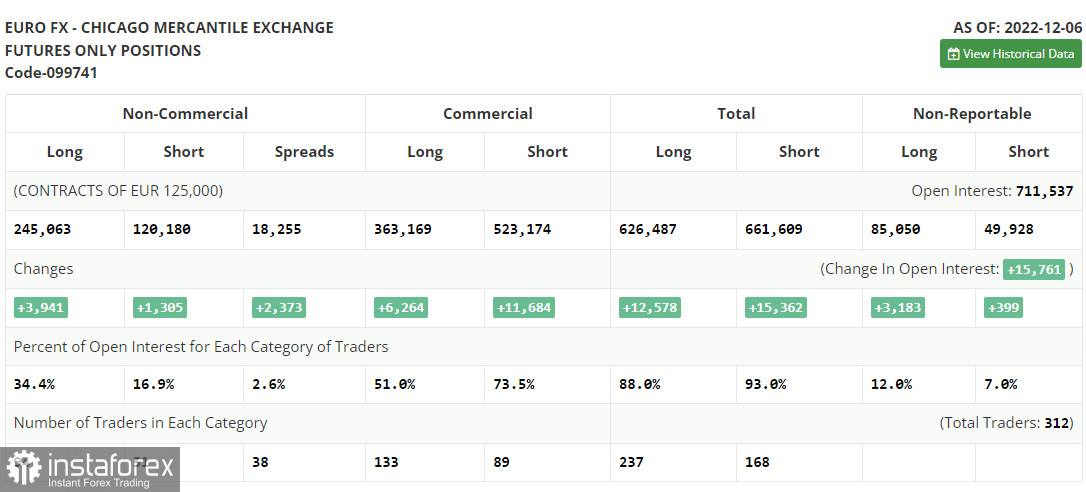
Before discussing the prospects of EUR/USD, let's first analyze the futures market and the Commitments of Traders report. The COT report for December 6 showed a rise in both long and short positions. Strong data on business activity in the US has offset the positive eurozone data on GDP for the third quarter. The latter was eventually revised upwards which supported the demand for risk assets. However, the situation may change this week ahead of the inflation data in the US. Unlike prevailing forecasts, US consumer prices are likely to have increased in November. If so, this data will again shake the market. In addition, the US Federal Reserve meeting will take place this week. Fed Chair Jerome Powell may change his stance to more hawkish, thus supporting the US dollar. In a different scenario, inflation may ease, and this will allow the euro to develop a strong uptrend by the end of the year. According to the latest COT report, long positions of the non-commercial group of traders increased by 3,941 to 245,063, while short positions jumped by 1,305 to 120,180. By the end of the week, the total non-commercial net position increased to 123,113 from 122,234. This is a clear sign that inverters are still optimistic about the euro and are ready to buy at the current levels if the fundamental background is favorable. The weekly closing price dropped to 1.0315 from 1.0342.
After rising in the first half of the day, the euro started to decline in the course of the North American session. Today, apart from the US inflation report, we have a bunch of important economic news during the European session. Thus, if Germany's consumer price index increases, the euro will also advance. The same is true for the ZEW economic sentiment indicator in Germany and the eurozone. In case of a negative reaction to the reports, buyers will have to do their best to defend the lower boundary of the sideways channel at 1.0511. If the pair depreciates, only a false breakout at 1.0511, similar to the one I mentioned yesterday, will be a reason for going long. If so, the pair may develop an uptrend toward the nearest resistance at 1.0546 where moving averages support the bears. A breakout of this range and its downward test will allow the bulls to push the price up to the high of 1.0584 provided that the eurozone data is positive. This will pave the way toward the upper target at 1.0624. The level of 1.0663 will act as the most distant target where I recommend profit taking. In case EUR/USD declines and bulls are idle at 1.0511, the pair may leave the bullish market. A false breakout of the next support at 1.0446 will be a good moment to buy the pair. Going long on EUR/USD right after a rebound is advisable only from the support of 1.0395 or from the low of 1.0346, keeping in mind a possible upside correction of 30-35 pips within the day.
For short positions on EUR/USD:
As the pair is trading in a sideways channel, the top priority for bears will be to maintain control over its lower boundary. At the same time, sellers also need to keep the price below the 1.0546 level as the pair may test it in the first half of the day amid positive data from the eurozone and increased risk appetite. The best moment to sell the pair in this case will be a false breakout at this level which will send the price lower to 1.0511. A breakout of this range and consolidation below it as well as its upward retest will form an additional sell signal with triggered stop-loss orders set by the bears. If so, the pair may decline further to 1.0446 where I recommend profit taking. The price may move below this level only in case of strong US data and a sharp rise in consumer prices. If EUR/USD advances in the course of the European session and bears are idle at 1.0546, the pair may surge to the upside. If this happens, it would be wise to wait until the price hits the upper boundary of the sideways channel at 1.0584. A false breakout at this level will create a new entry point for going short. You can sell EUR/USD immediately after a rebound from the new December high of 1.0624 or even higher from 1.0663, considering a downward correction of 30-35 pips within the day.
Indicator signals:
Moving Averages
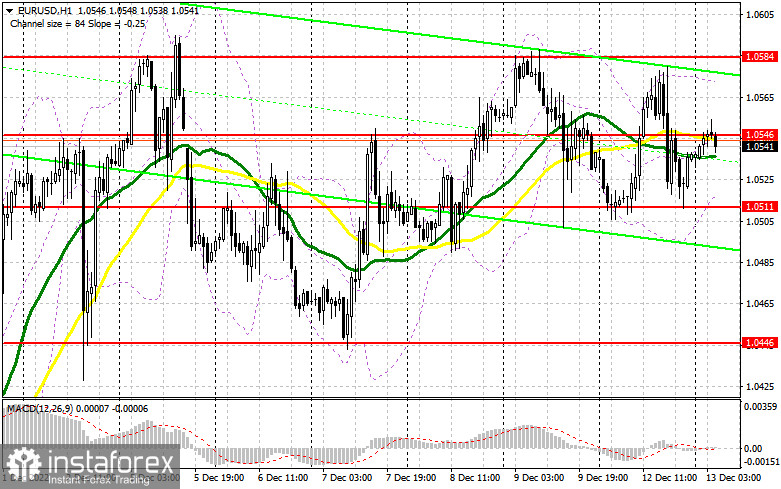
Trading below the 30- and 50-day moving averages indicates a decline in the euro.
Please note that the time period and levels of the moving averages are analyzed only for the H1 chart, which differs from the general definition of the classic daily moving averages on the D1 chart.
Bollinger Bands
In case of a decline, the lower band of the indicator at 1.0511 will serve as support. If the price goes up, the upper band of the indicator at 1.0508 will act as resistance.
Description of indicators:
• A moving average of a 50-day period determines the current trend by smoothing volatility and noise; marked in yellow on the chart;
• A moving average of a 30-day period determines the current trend by smoothing volatility and noise; marked in green on the chart;
• MACD Indicator (Moving Average Convergence/Divergence) Fast EMA with a 12-day period; Slow EMA with a 26-day period. SMA with a 9-day period;
• Bollinger Bands: 20-day period;
• Non-commercial traders are speculators such as individual traders, hedge funds, and large institutions who use the futures market for speculative purposes and meet certain requirements;
• Long non-commercial positions represent the total number of long positions opened by non-commercial traders;
• Short non-commercial positions represent the total number of short positions opened by non-commercial traders;
• The non-commercial net position is the difference between short and long positions of non-commercial traders.


