


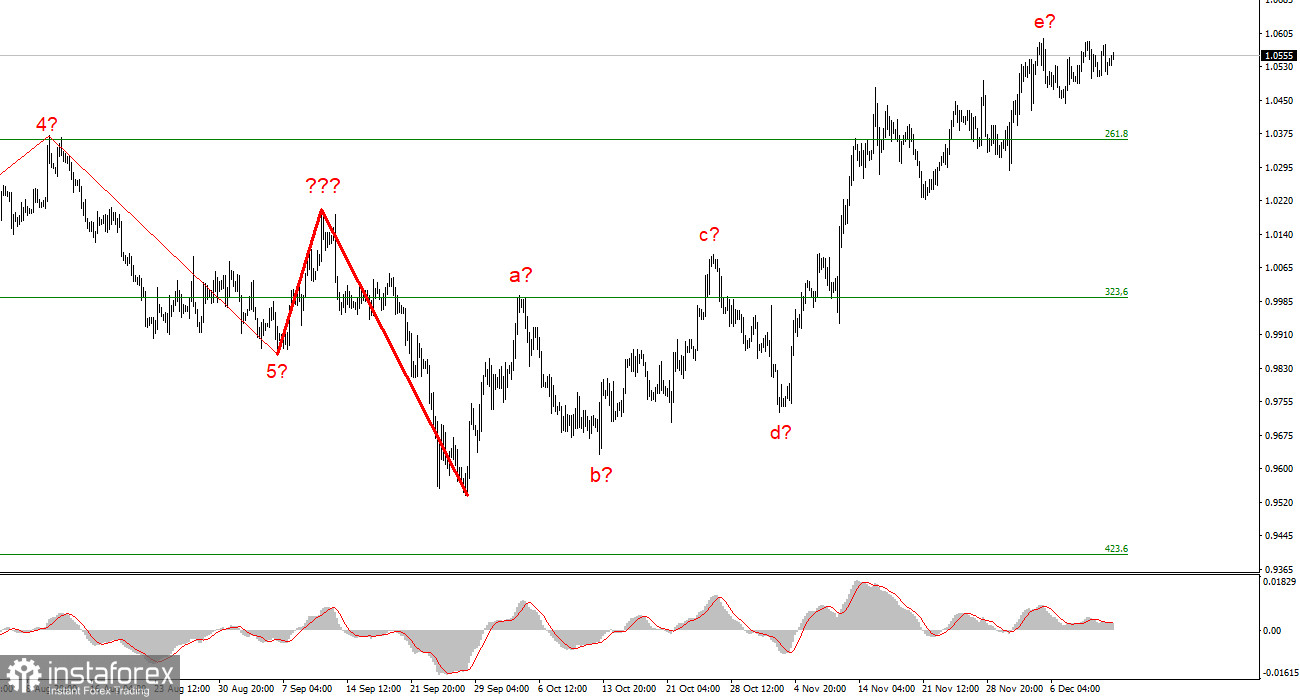
The wave marking on the euro/dollar instrument's 4-hour chart still appears to be quite accurate, but the entire upward section of the trend is becoming more convoluted. It has already assumed a clear corrective and somewhat prolonged form. The waves a-b-c-d-e have been combined into a complex correction structure, with wave e having a significantly more complex form than the other waves. Since wave e is much higher than the peak of wave C, if the wave markings are accurate, construction on this structure may be nearly finished. In this instance, it is anticipated that we will construct at least three waves downward, but if the most recent phase of the trend is corrective, the subsequent phase will probably be impulsive. Therefore, I am preparing for a new, significant decline in the instrument. The market will be ready to sell when a new attempt to break the 1.0359 mark, which corresponds to 261.8% Fibonacci, is successful. The last decline of the instrument, however, is not the first wave of a new descending section; rather, the rise in the instrument's quotes over the past few weeks suggests that the entire wave e may end up being longer. Consequently, the scenario involving the first two waves of a new downward trend segment is rejected. Because there is no increase in demand for US currency, the wave pattern starts to become muddled and complex.
The euro/dollar exchange rate is steady.
On Tuesday, the euro/dollar instrument increased by ten basis points. The second day of the week's amplitude is still very small, and the instrument moves horizontally rather than upward or downward. As a result, the instrument is essentially unaffected by the current wave pattern. Although the upward portion of the trend should have ended a long time ago, the formation of a corrective wave has yet to start. If my assumption is incorrect and the upward portion of the trend has yet to end, then there is also no current increase in quotes.
There were no significant updates from the United States and the European Union during Monday and the first half of Tuesday. Even though there weren't many last week, there was still something. The first significant event of the week for the instrument will be the release of the November inflation report today in America. Everything there is to say about US inflation has already been said. Participants in the market found unity in the following equation. The Fed will likely make statements about the need to slow down the pace of monetary policy tightening if inflation declines significantly, which will be bad for the US dollar. On the other hand, if inflation slows down, we can anticipate a further 50 basis point increase in interest rates from the Fed in February. The second choice is undoubtedly better for the dollar. However, the US dollar has fallen too far in recent weeks, and it is getting harder daily to ignore the wave markings. The market is currently "on pause" and in equilibrium. Since there aren't any movements, this can be unnerving. However, this week will bring about the conclusion and provide some clarification.
Conclusions in general
The upward trend section's construction has grown more intricate and is almost finished. As a result, I suggest making sales with targets close to the estimated 0.9994 level, or 323.6% Fibonacci. The potential for complicating and extending the upward portion of the trend remains high, as does the likelihood of this happening.
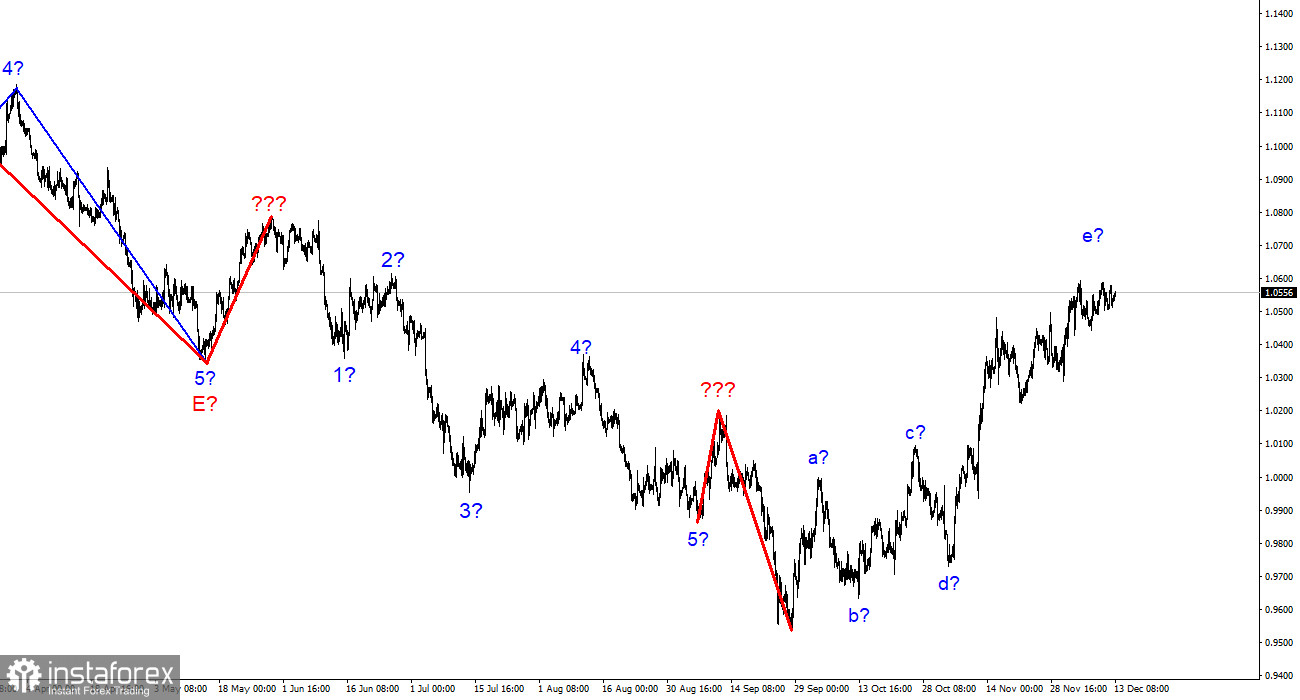
The wave marking of the descending trend segment becomes more intricate and lengthens at the higher wave scale. The a-b-c-d-e structure is most likely represented by the five upward waves we observed. After the construction of this section is finished, work on a downward trend section may resume.


