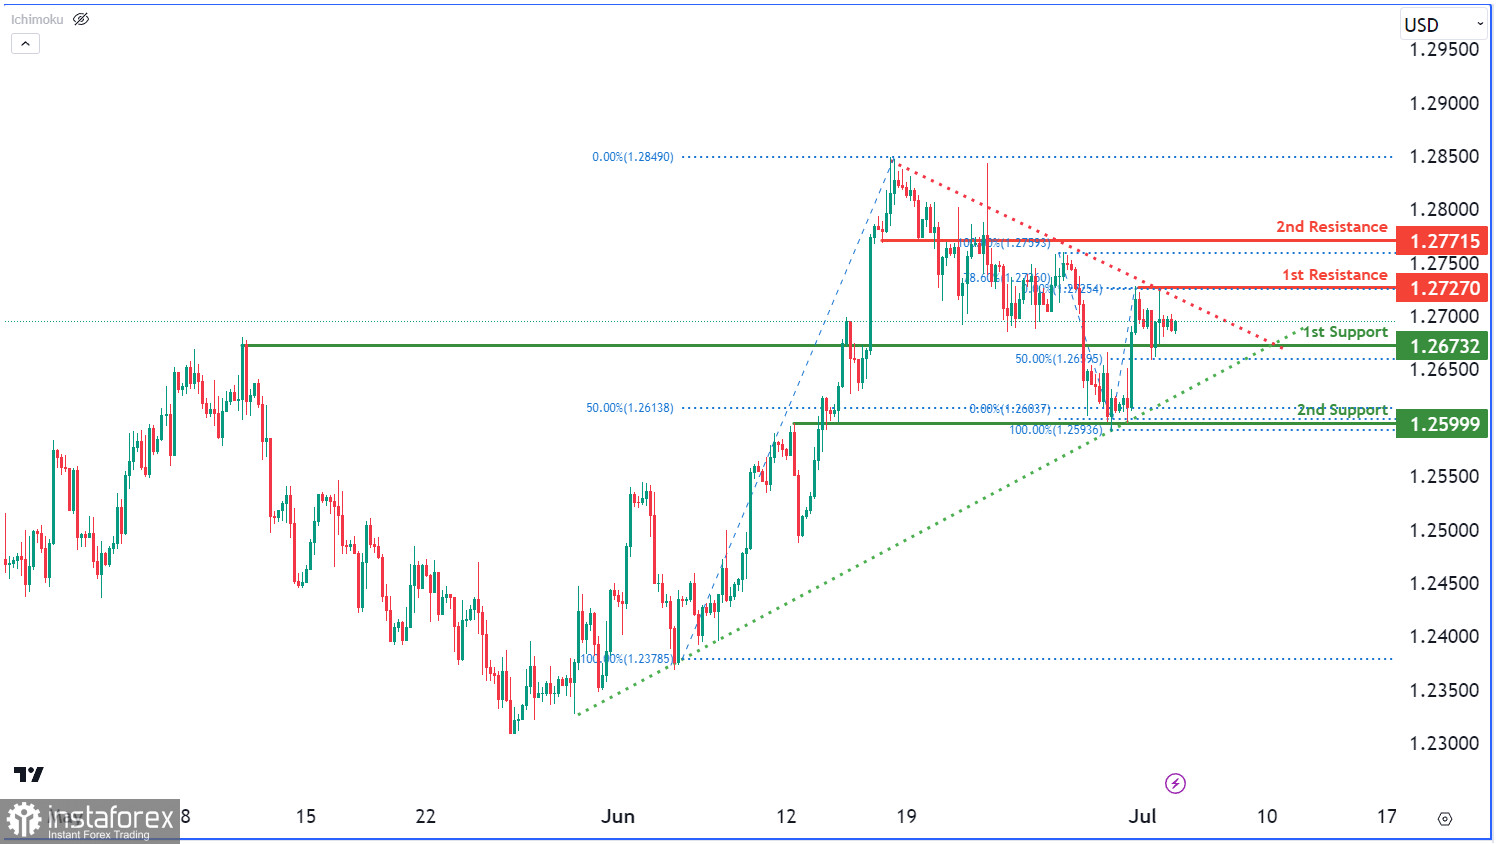
GBP/USD chart shows a neutral momentum, lacking clear direction. Price may fluctuate between the 1st resistance at 1.2727 and the 1st support at 1.2673. Supports include overlaps and Fibonacci Retracement, while resistances are multi-swing highs and overlaps. A symmetrical triangle pattern suggests consolidation, with potential for bullish or bearish breakout


