


After rising at the beginning of the week to an intra-week high of 4136.00, the S&P 500 (reflected as CFD #SPX in the trading terminal) fell sharply on Thursday, having lost more than 7%. Today, S&P 500 futures were down again in the first half of the trading day.
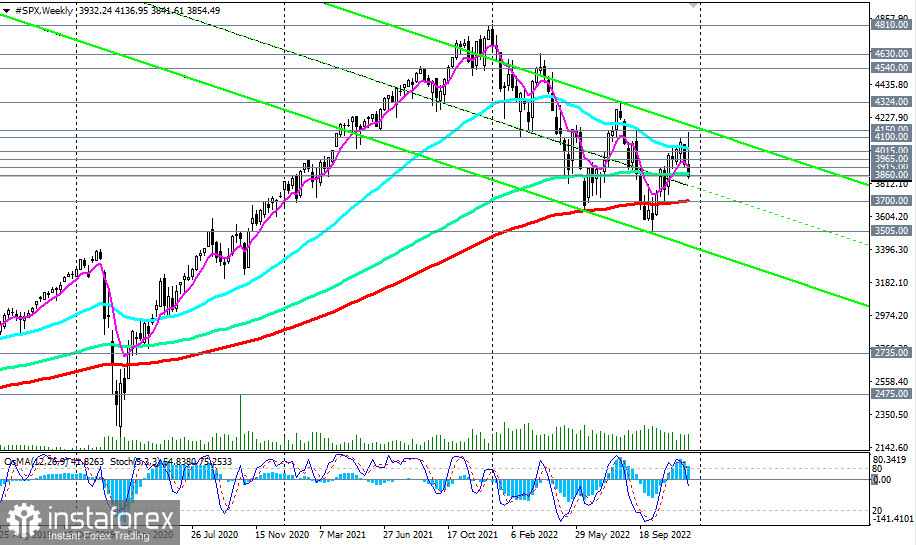
The pessimism that gripped investors and the moderately hawkish rhetoric of Fed Chairman Jerome Powell forced investors to seek refuge in a protective and more profitable dollar. As of writing, S&P 500 futures are trading near the 3860.00 mark, having found support at an important long-term level (144 EMA on the weekly chart). Presumably, the breakdown of the 3700.00 key long-term support level (200 EMA on the weekly chart) significantly increases the risks of breaking the long-term bullish trend of the S&P500.
However, for this, the price needs to fall below 2800.00, or even better—below the 2500.00 key support level (200 EMA on the monthly chart). And we see that it is still a long way off, as seen in the charts.
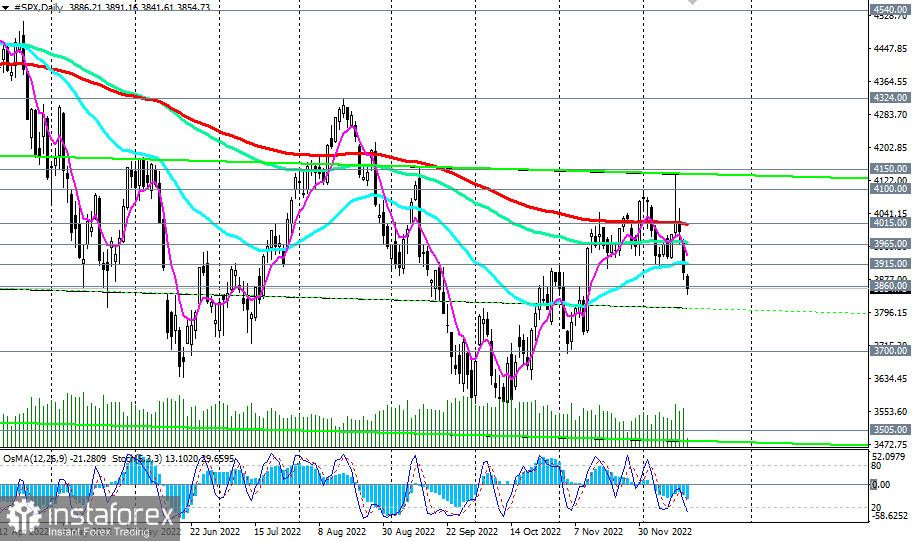
The most probable scenario is the rise above the 4015.00 key resistance level (200 EMA on the S&P500 daily chart) with immediate targets at 4100.00, 4150.00. Presumably, these levels can be achieved during the "traditional pre-New Year's rally" if it takes place. And if not, what then? Further decline? Since Powell does not deny the likelihood of a recession in the United States.
Obviously, it is not worth guessing, and it is better to turn to technical analysis, following the news and correctly placing stops against losses.
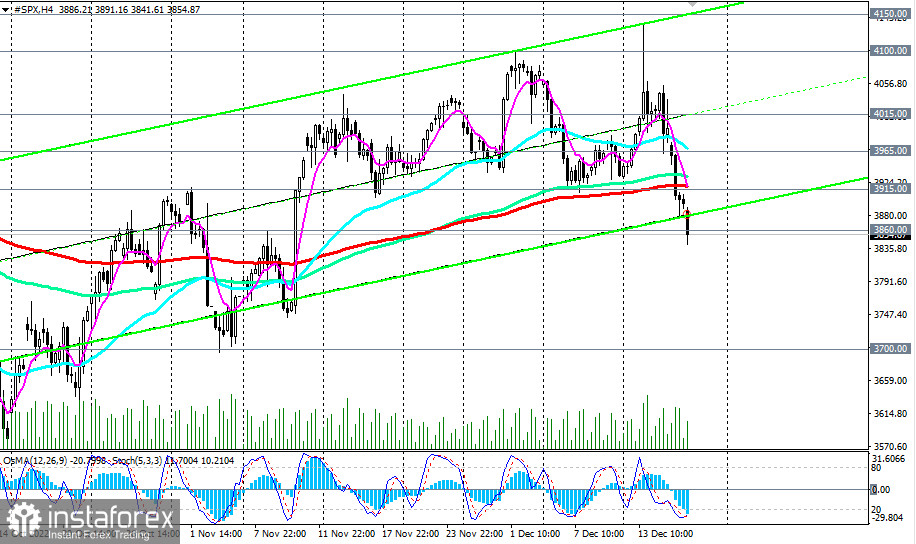
The first signal to buy the S&P500 may be on a breakdown of 3900.00, or even better—3915.00, through which an important short-term resistance level (200 EMA on the 4-hour chart) passes.
Support levels: 3860.00, 3800.00, 3700.00, 3600.00, 3500.00
Resistance levels: 3900.00, 3915.00, 3965.00, 4015.00, 4100.00, 4150.00
Trading Tips
Sell Stop 3830.00. Stop-Loss 3920.00. Whole 3800.00, 3700.00, 3600.00, 3500.00
Buy Stop 3920.00. Stop-Loss 3830.00. Whole 3965.00, 4015.00, 4100.00, 4150.00


