


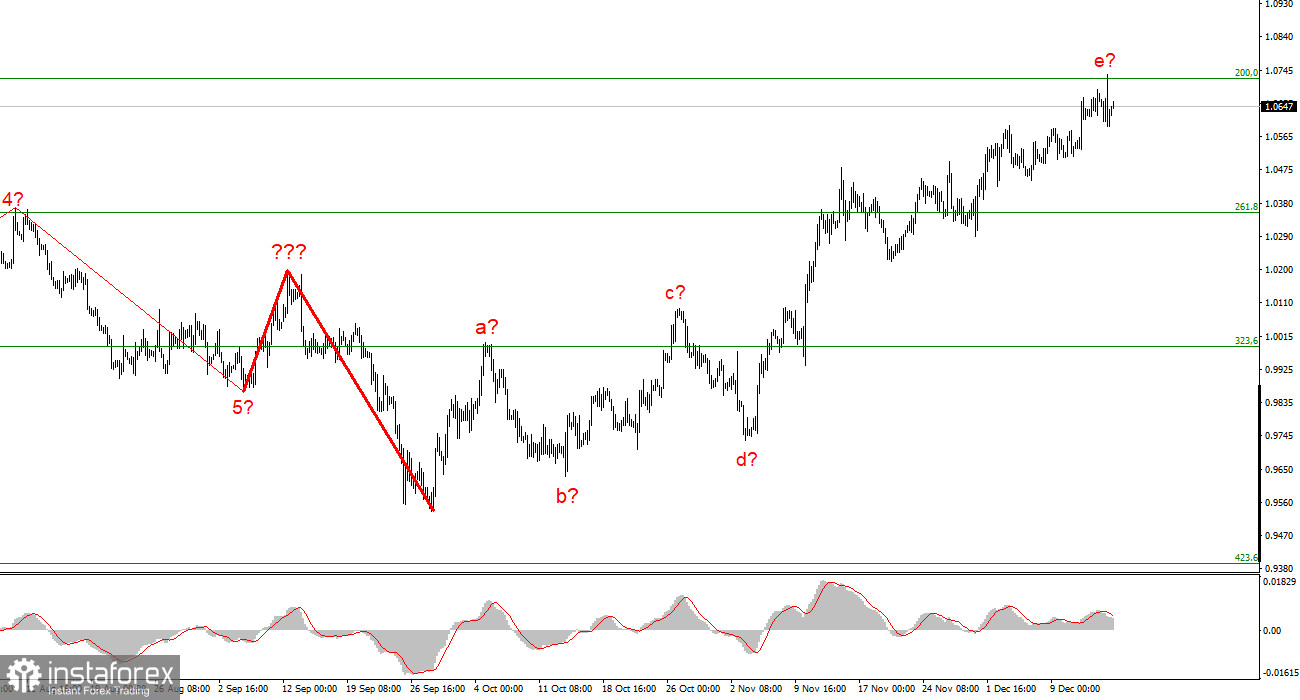
The wave marking on the euro/dollar instrument's 4-hour chart still appears to be quite accurate, but the entire upward section of the trend is becoming more complicated. It has already assumed a clear corrective and somewhat prolonged form. The waves a-b-c-d-e have been combined into a complex correction structure, with wave e having a significantly more complex form than the other waves. Since wave e is much higher than the peak of wave C, if the wave markings are accurate, construction on this structure may be nearly finished. In this instance, it is anticipated that we will construct at least three waves downward, but if the most recent phase of the trend is corrective, the subsequent phase will probably be impulsive. Therefore, I am preparing for a new, significant decline in the instrument. The market will be ready for sales when a bid to surpass the 1.0726 level, which corresponds to 200.0% by Fibonacci, fails. However, the recent increase in the instrument's quotes suggests that the overall wave e may end up longer. The demand for US dollars is still not increasing, and the internal wave structure of wave e needs to be clarified. The wave pattern keeps getting more perplexing and intricate.
The euro's situation could have been much worse.
On Thursday, the euro/dollar instrument decreased by 50 basis points; as of today, nothing has changed. Generally speaking, the European currency has only lost 50 points since yesterday. Reports on inflation and economic activity were published the week two central bank meetings were held. The euro has resolutely withstood all of the pressures that have come from significant news and events. The Fed and ECB both increased interest rates by 50 basis points. The American regulator anticipated a similar decision, but only partially from the ECB, given that the Fed rate is twice as high as the ECB rate. We might also anticipate tougher decisions and language from the ECB, given that inflation in the European Union is significantly higher than in the United States. However, the European regulator was content to announce the beginning of a balance sheet reduction program in the first quarter of 2023, which was sufficient to ensure that demand for the euro did not fall. Thus, despite an unsuccessful attempt to break through the 1.0725 level, which corresponds to 200.0% Fibonacci, wave e has yet to show any signs of completion.
Indicators of business activity have been made public in the European Union today. The index rose to 47.8 points in the manufacturing and 49.1 points in the services sectors. The total increased to 48.8. Thus, despite a slight increase across the board, none of the three indices reached the critical level of 50.0, below which any indicator value is regarded as negative. The business activity index cannot, therefore, be categorized as either positive or negative. This information received no response from the market. The current week is still not a "key" one, and the tool can still make the upward trend section more difficult.
Conclusions in general
I conclude from the analysis that the upward trend section's construction has grown more intricate and is almost finished. As a result, I suggest making sales with targets close to the estimated 0.9994 level, or 323.6% Fibonacci. You should wait for a strong sales signal because the upward section of trend could become even more extended and complicated. The likelihood of this happening is still high.
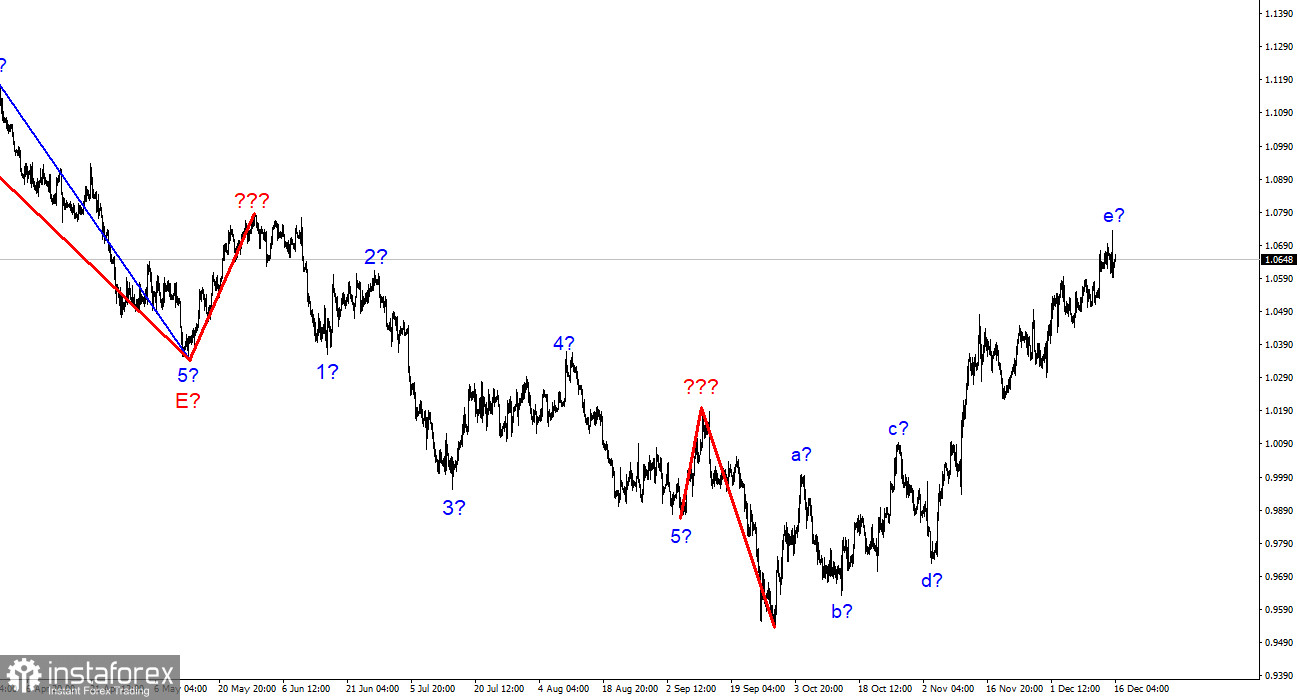
The wave marking of the descending trend segment becomes more intricate and lengthens at the higher wave scale. The a-b-c-d-e structure is most likely represented by the five upward waves we observed. After this section is completed, work on a downward trend section may resume.


