


Analyzing Friday trades:
EUR/USD on 30M chart
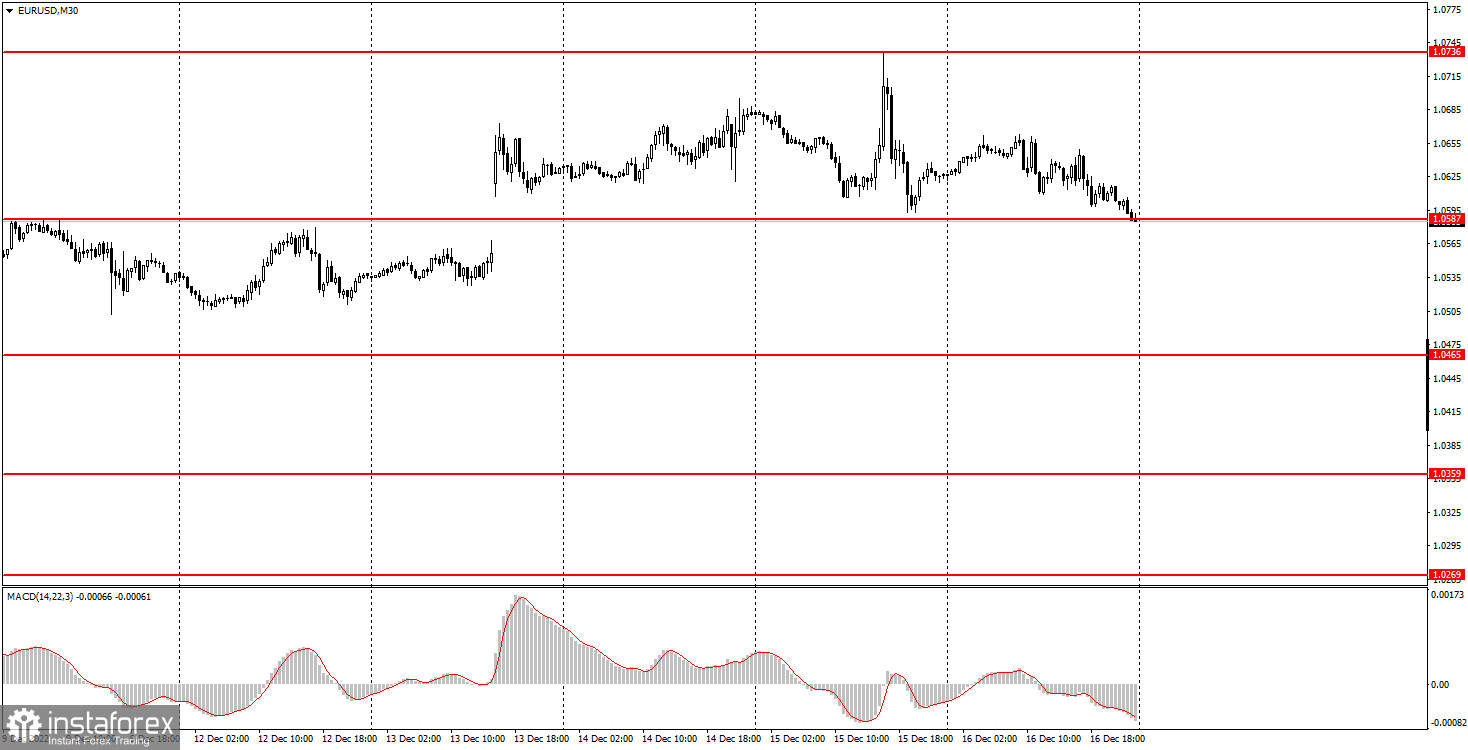
EUR/USD traded in a strange manner on Friday, which was observed for most of the past week. On the one hand, each movement can be explained. On the other hand, the pair could trade in a completely different way, it could show higher volatility, a trend and could finally start a bearish correction. But none of this happened, although three central bank meetings were held during the week and many important reports were released. On Friday, the volatility of EUR/USD was as much as 80 points, although at least six relatively important reports were released on that day. Reports on business activity in the services and manufacturing sectors in the EU rose slightly, but remained below the level of 50.0, which is considered as a "waterline", below which any value is considered negative. The U.S. PMIs fell even deeper in December, below the 50.0 level. Thus, there were at least two pivot points during the day, which were related to the macro data. The pair is currently in an improvised horizontal channel between the levels 1.0587 and 1.0736.
EUR/USD on M5 chart
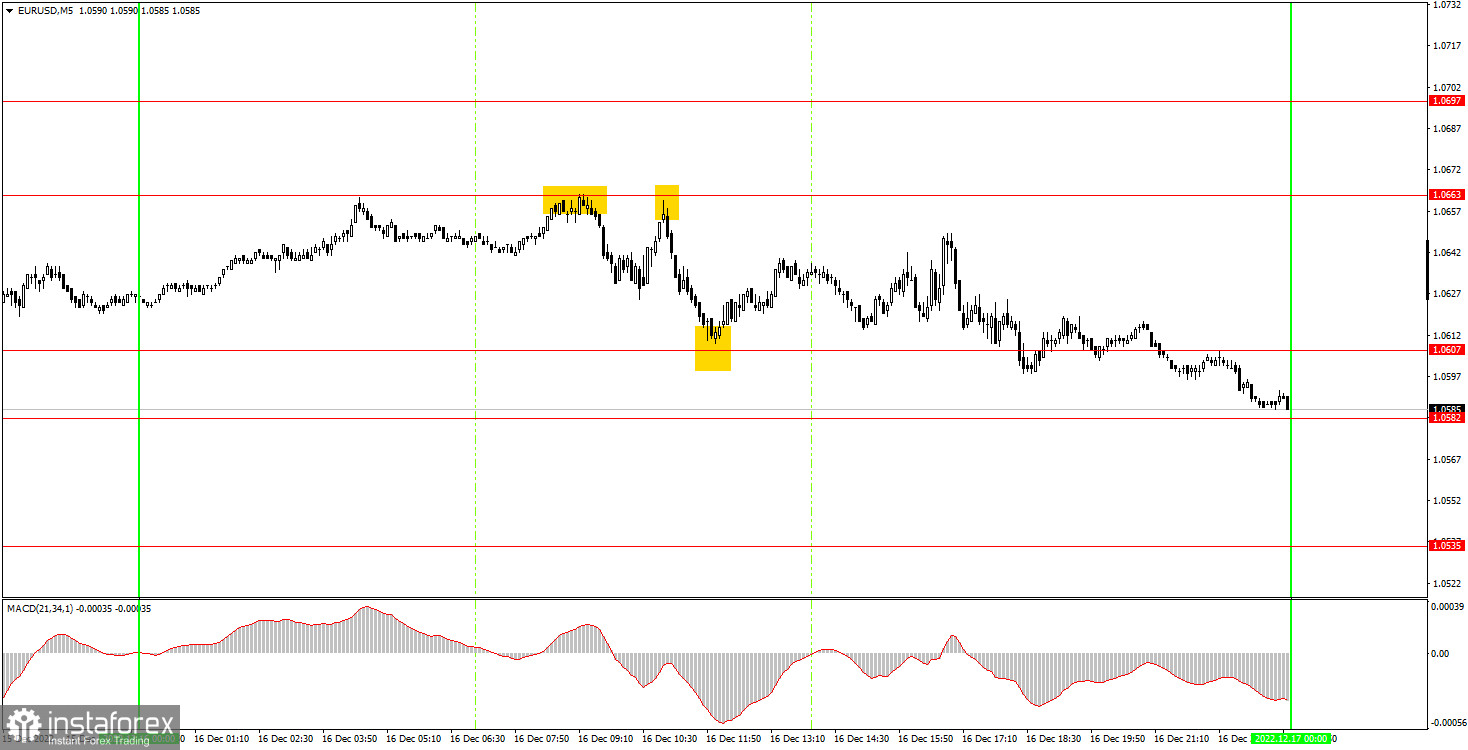
On Friday, beginners and traders in general were lucky. There were many reversals during the day and the trend movement was very weak. Therefore, the number of false signals could be high. But in fact, there were only three signals, all at the European trading session. First, the pair rebounded twice from 1.0663. In the first case, Stop Loss was triggered at Breakeven, as the price went down 15 points. In the second case, the price went down to the nearest target level of 1.0607 (2 pips margin of error), where beginners could take profit. The rebound from 1.0607 could have been used to open a position as well, but the pair failed to return to 1.0663, so a long position could have been closed with small profit later in the evening, or a Stop Loss at breakeven. Anyway, the day turned out to be profitable.
Trading tips on Monday:
EUR/USD is still trading high on the 30-minute time chart, even after the two central bank meetings. Thus, the technical picture did not change drastically this week. There is still no trend line or channel. The bearish correction keeps brewing, but it will not start. The pair is now in the horizontal channel at 1.0587-1.0736. On the 5-minute chart tomorrow, it is recommended to trade at the levels of 1.0465-1.0483, 1.0536, 1.0582-1.0607, 1.0663, 1.0697, 1.0736, 1.0787, 1.0806. As soon as the price passes 15 pips in the right direction, you should set a Stop Loss to breakeven. There are no important reports or events scheduled for Monday in the EU or the US. Therefore, there will be nothing to react during the day. I still expect a strong bearish correction, but now EUR needs to cross 1.0587.
Basic rules of the trading system:
1) The strength of the signal is determined by the time it took the signal to form (a rebound or a breakout of the level). The quicker it is formed, the stronger the signal is.
2) If two or more positions were opened near a certain level based on a false signal (which did not trigger a Take Profit or test the nearest target level), then all subsequent signals at this level should be ignored.
3) When trading flat, a pair can form multiple false signals or not form them at all. In any case, it is better to stop trading at the first sign of a flat movement.
4) Trades should be opened in the period between the start of the European session and the middle of the US trading hours when all positions must be closed manually.
5) You can trade using signals from the MACD indicator on the 30-minute time frame only amid strong volatility and a clear trend that should be confirmed by a trendline or a trend channel.
6) If two levels are located too close to each other (from 5 to 15 pips), they should be considered support and resistance levels.
On the chart:
Support and Resistance levels are the levels that serve as targets when buying or selling the pair. You can place Take Profit near these levels.
Red lines are channels or trend lines that display the current trend and show in which direction it is better to trade now.
The MACD indicator (14, 22, and 3) consists of a histogram and a signal line. When they cross, this is a signal to enter the market. It is recommended to use this indicator in combination with trend patterns (channels and trendlines).
Important announcements and economic reports that can be found on the economic calendar can seriously influence the trajectory of a currency pair. Therefore, at the time of their release, we recommend trading as carefully as possible or exiting the market in order to avoid sharp price fluctuations.
Beginners on Forex should remember that not every single trade has to be profitable. The development of a clear strategy and money management is the key to success in trading over a long period of time.


