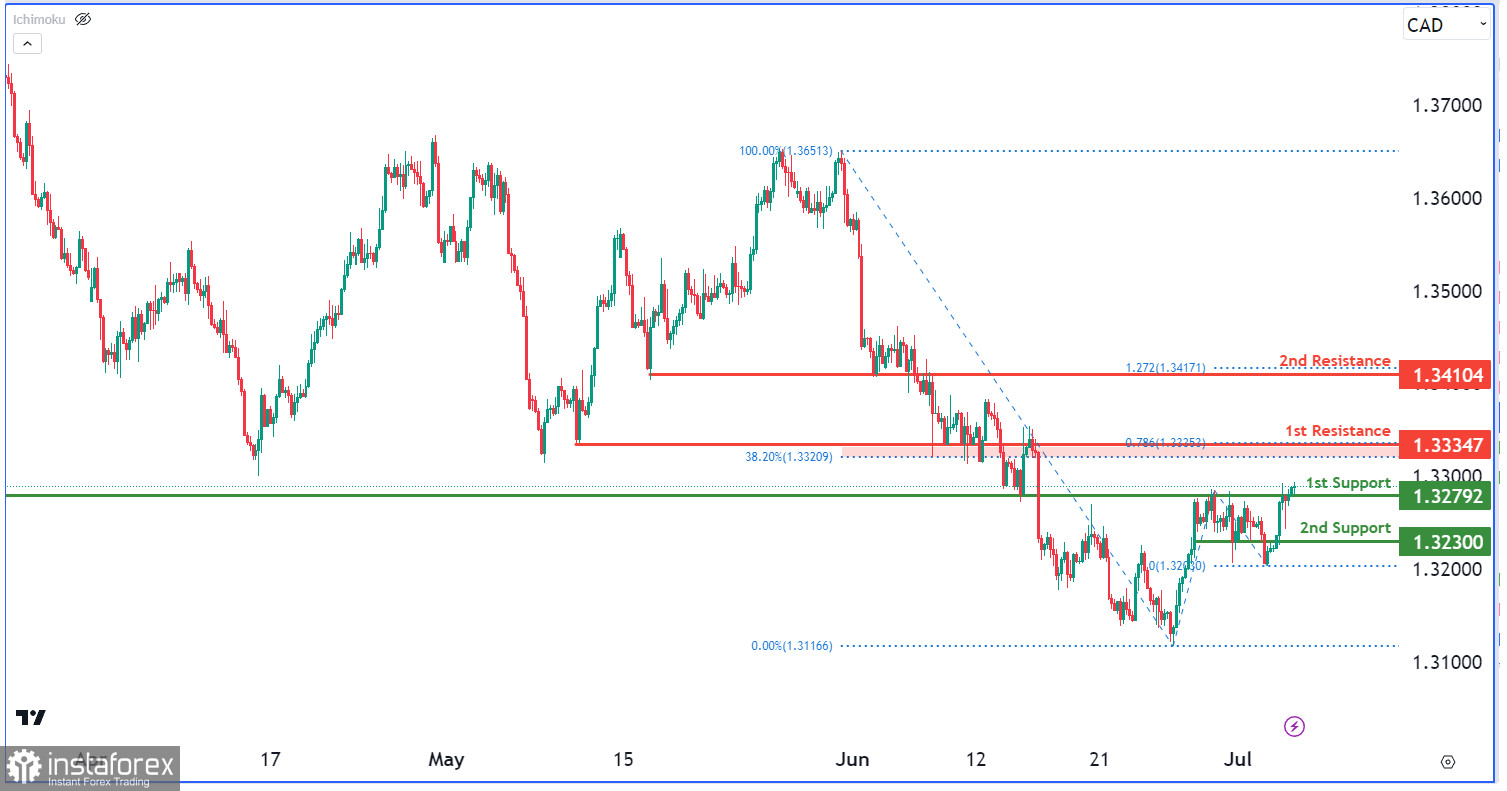
The USD/CAD chart shows weak bearish momentum with low confidence, indicating a lack of clear market direction. There is a potential for a bearish reaction from the 1st resistance at 1.3334, a pullback resistance with Fibonacci confluence. This could lead to a drop towards the 1st support at 1.3279, an overlap support. The 2nd support at 1.3230 acts as a pullback support. On the upside, the 2nd resistance at 1.3410 is an overlap resistance with a 100% Fibonacci Projection.


