Details of economic calendar on December 19
The economic calendar was traditionally empty on Monday. No macroeconomic data was released in the EU, the US, and the UK to influence the trajectories of the currency pairs.
Overview of technical charts on December 19
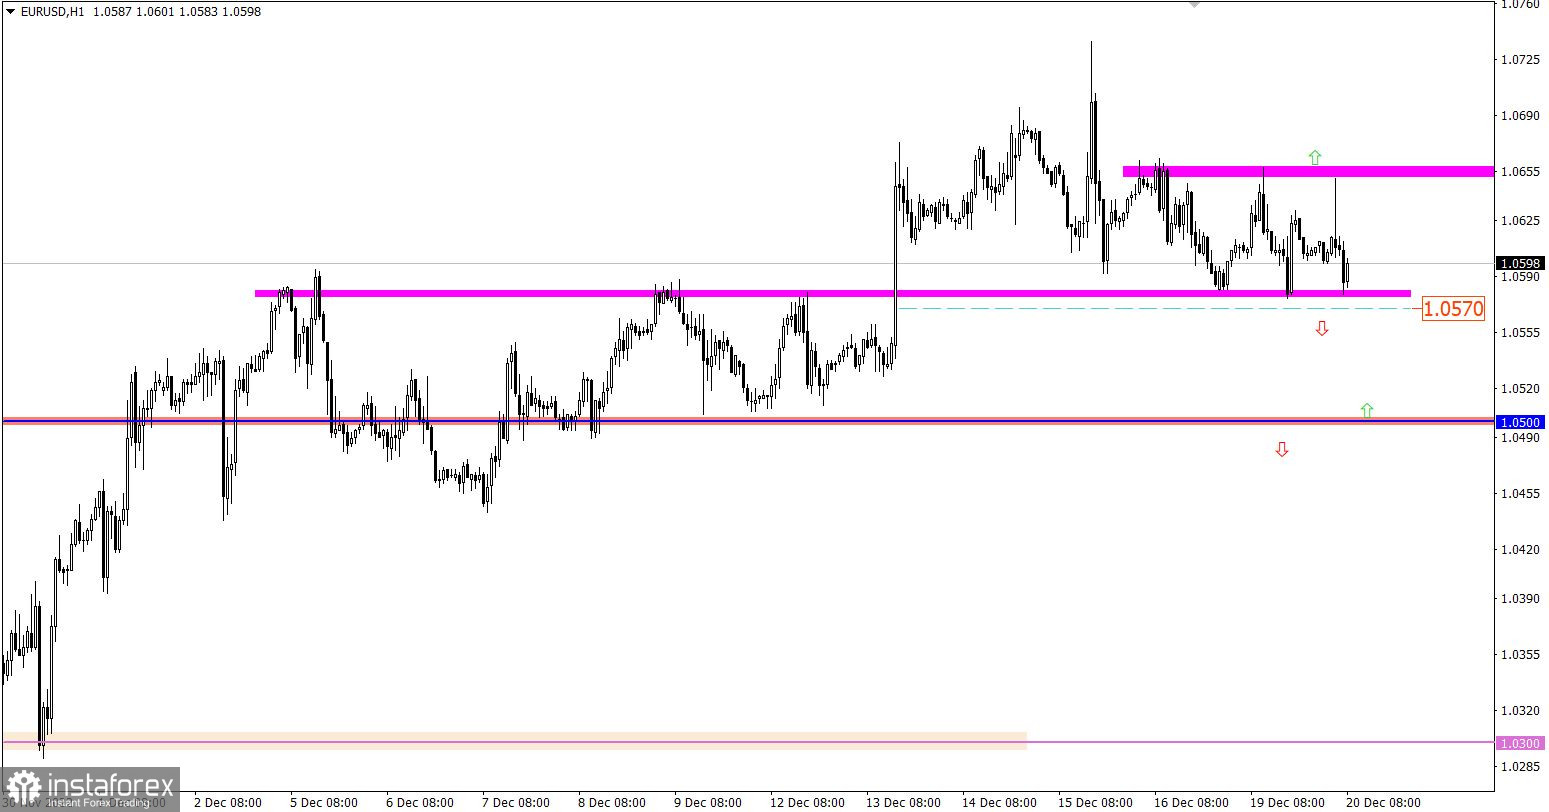
The price slackened off its retracement from the peak of the bullish cycle and got stuck at about 1.0580. As a result, EUR/USD has been trading sideways within the borders of 1.0580 and 1.0660.
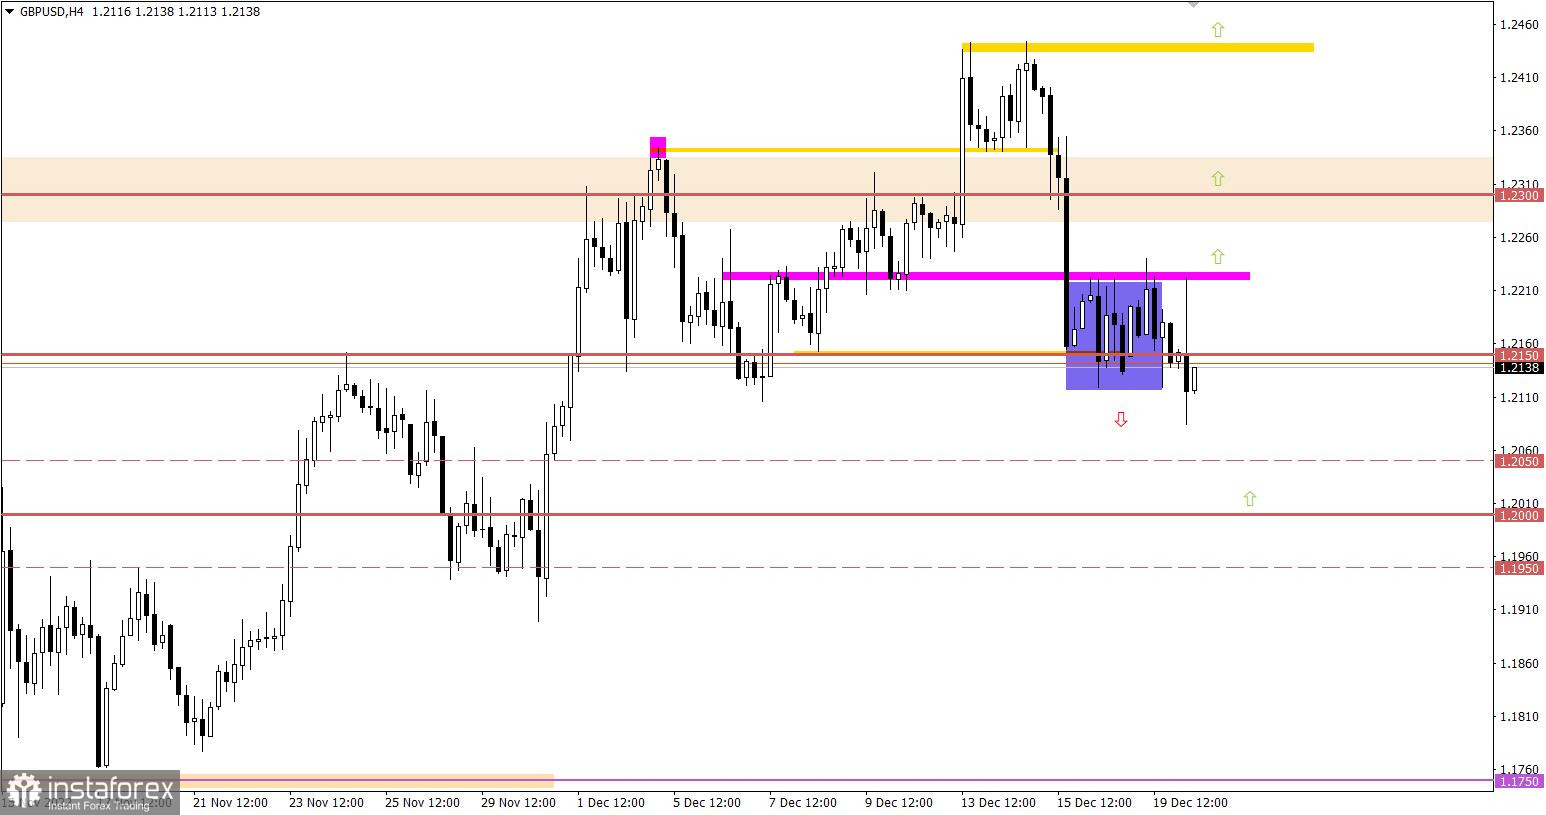
GBP/USD has been also trapped at around 1.2150. The range-bound market is proven by the fact that the price settled below 1.2150 on the 4-hour chart.

Economic calendar on December 20
On Tuesday, the economic calendar remains light in terms of macroeconomic data. No reports are published in Europe and the UK. However, the US is due to report on its building permits and housing starts. Both metrics are expected to log a decline.
Schedule
US Building permits (November) – 13:30 GMT
Housing starts (November) – 13:30 GMT
Trading plan for EUR/USD on December 20
The currency pair has been locked inside a trading range which always means the accumulation of trading forces. Therefore, a reasonable trading strategy for today is a breakout strategy. So, we should wait until the price moves beyond any of the borders.
To sum up, there are two scenarios.
The upward scenario will be considered by traders in case the price settles above 1.0670 in the 4-hour timeframe. This move will reinforce long positions. In turn, the price could update an intraday high of the ascending cycle.
The downward scenario will come into play in case the price settles below 1.0570 in the 4-hour timeframe. As a result, the price could retreat back to 1.0500.

Trading plan for GBP/USD on December 20
Under such market conditions, the instrument will generate a technical signal of an extended downward cycle only on the condition the price settles below 1.2100. In this case, GBP/USD might sink to 1.2000. The currency pair is still expected to get stuck in a range between 1.2100 and 1.2230 indefinitely.

What's on the charts
The candlestick chart type is white and black graphic rectangles with lines above and below. With a detailed analysis of each individual candle, you can see its characteristics relative to a particular time frame: the opening price, closing price, intraday high and low.
Horizontal levels are price coordinates, relative to which a price may stop or reverse its trajectory. In the market, these levels are called support and resistance.
Circles and rectangles are highlighted examples where the price reversed in history. This color highlighting indicates horizontal lines that may put pressure on the asset's price in the future.
The up/down arrows are landmarks of the possible price direction in the future.


