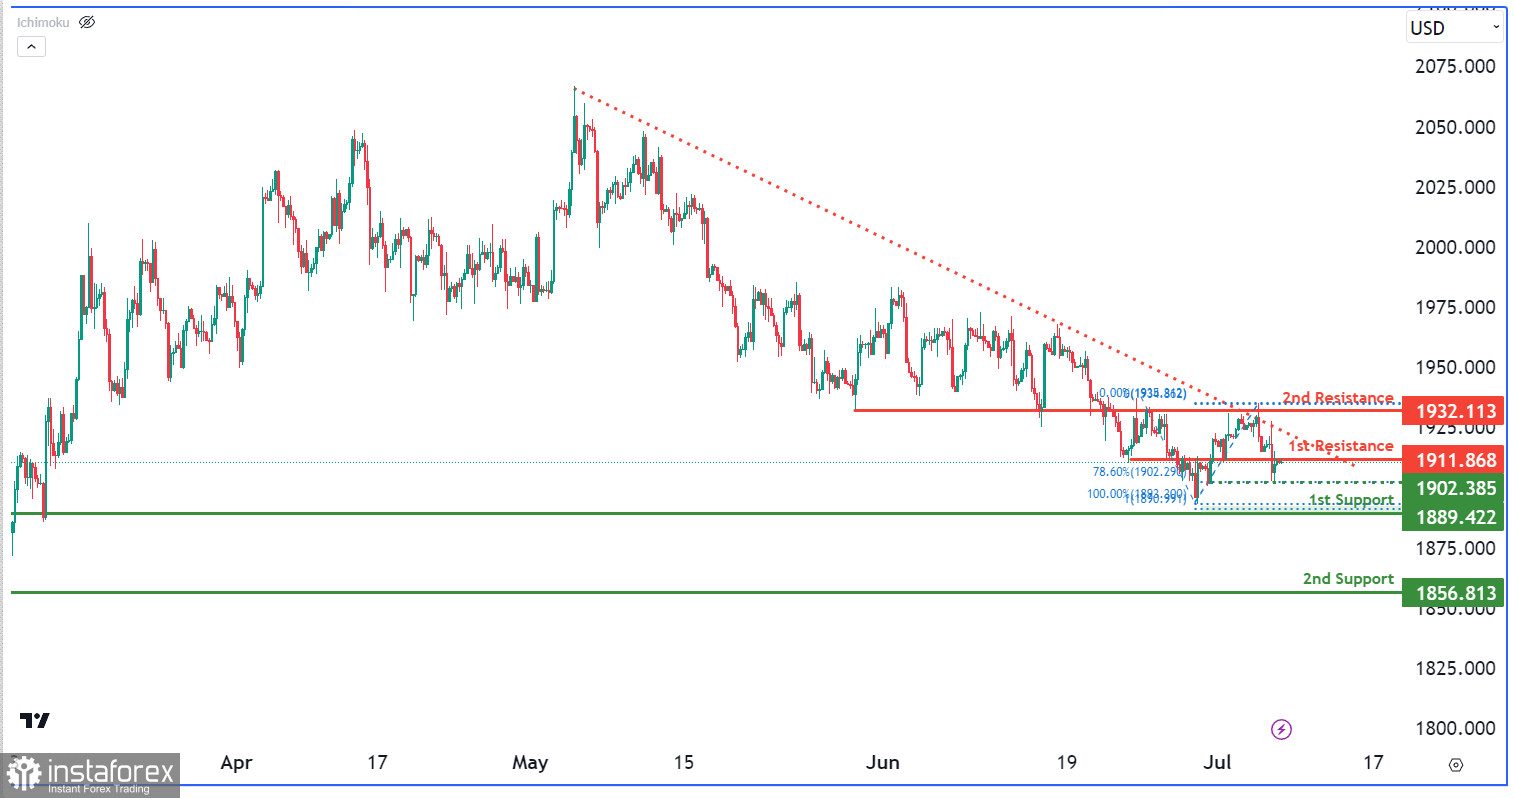
The XAU/USD (Gold) chart shows bearish momentum, with the price below a major descending trend line and encountering resistance from another descending trend line.
Potential for a bearish reaction at the 1st resistance level of 1911.86, followed by a decline towards the 1st support level at 1889.42 (overlap support, 100% Fibonacci Projection).
Intermediate support at 1902.38 (multi-swing low support, 78.60% Fibonacci Retracement). 2nd resistance at 1932.11 (overlap resistance, 78.60% Fibonacci Retracement).


