


Analyzing Tuesday's trades:
EUR/USD on 30M chart
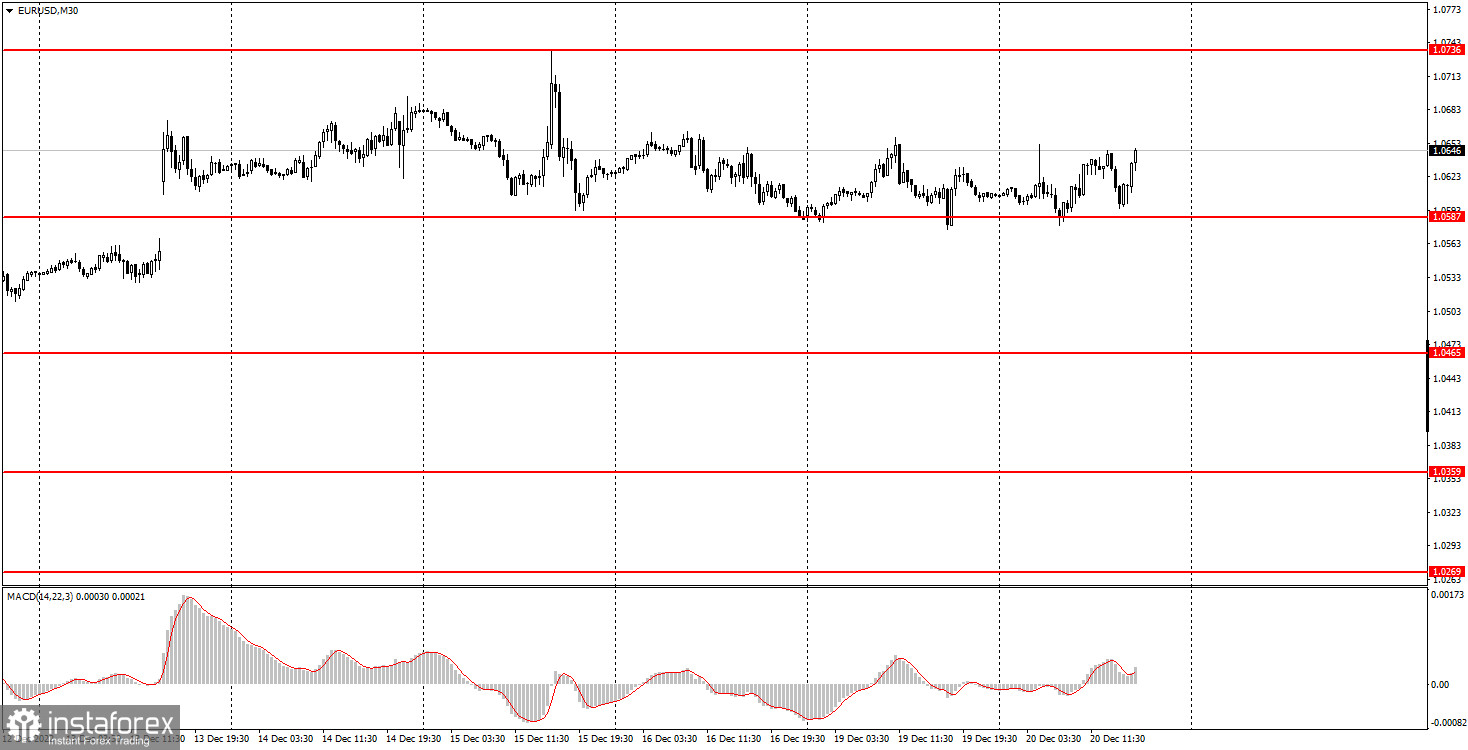
EUR/USD trades flat on Tuesday. This is perfectly visible in the chart, you don't even need to add any supporting channels or trend lines on it to see the flat. The pair is still between the levels of 1.0587 and 1.0736 and it failed to cross the first one twice. It's not surprising that the pair behaved this way because there is no fundamental or macroeconomic background. Once again, please remember that we are slowly entering the New Year and Christmas holidays, so volatility may fall even more, and the trend movement may disappear. So far, that's exactly what we're seeing. This week there will be an extremely small number of reports, and some of them aren't even important. I believe that none of them will provoke a serious market reaction. And if it does, then it will be within the same horizontal channel. Beginners should decide for themselves whether they want to trade in such conditions, since there is a high probability of a loss during a flat.
EUR/USD on M5 chart
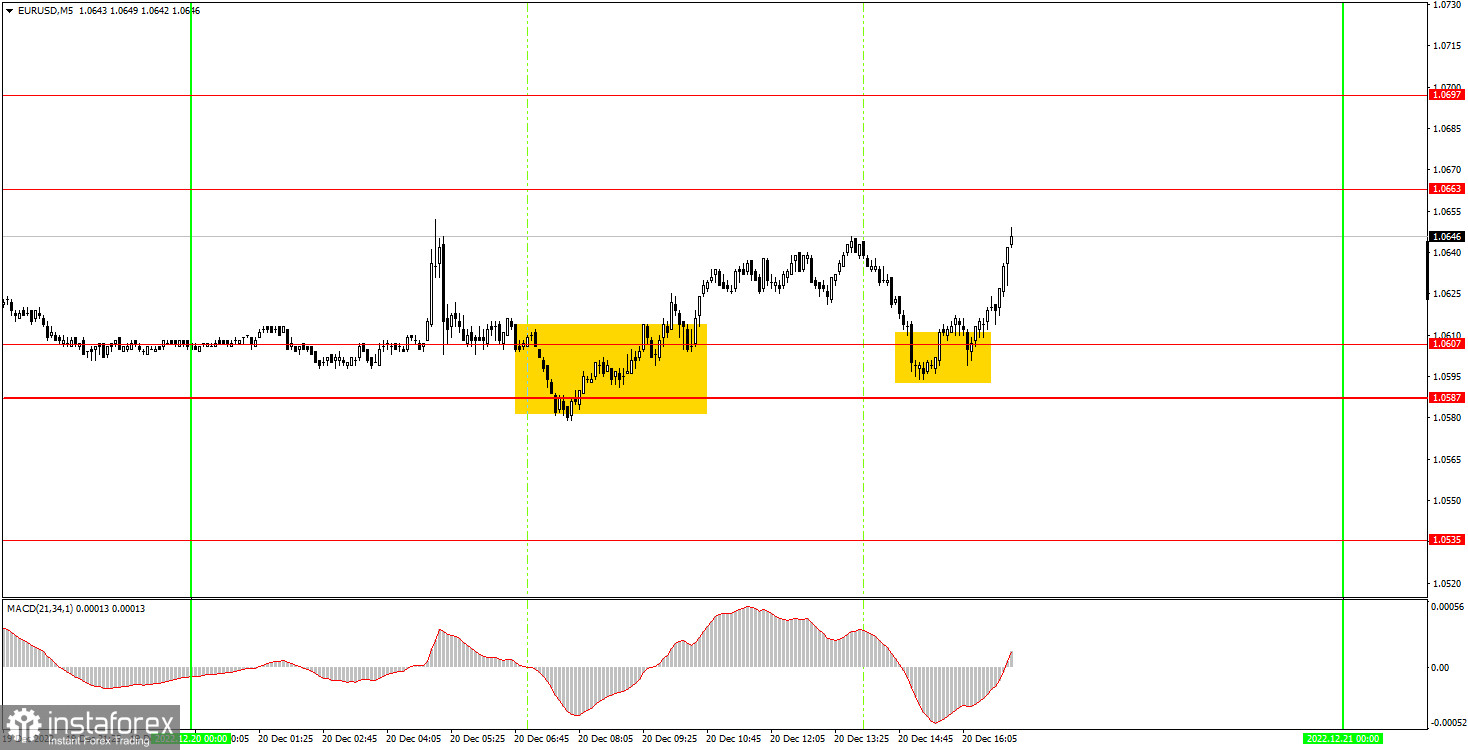
On Tuesday, novice traders were lucky again, since a much larger number of signals could be formed during the day, most of which would be false. However, only two were formed on Tuesday, both near the 1.0587-1.0607 area. The pair bounced off it twice and only managed to reach the nearest target level of 1.0663 (with a minimum error) for the second time. Thus, the first long position closed at a Stop Loss at breakeven, as the pair went up 15 points, and the second one – in profit of about 40 points. Considering the total flat in recent days, 40 points of profit is an excellent result.
Trading tips on Wednesday:
On the 30-minute chart, the pair continues to be in the 1.0587-1.0736 horizontal channel. Thus, in order to count on at least some trend, it is necessary for the pair to leave this range. The direction of movement will be determined once EUR crosses the limit. On the 5-minute chart on Wednesday, it is recommended to trade at the levels of 1.0465-1.0483, 1.0536, 1.0587-1.0607, 1.0663, 1.0697, 1.0736, 1.0787, 1.0806. As soon as the price passes 15 pips in the right direction, you should set a Stop Loss to breakeven. No important events planned in the European Union and the United States again. Thus, there is every reason to assume that the flat will persist.
Basic rules of the trading system:
1) The strength of the signal is determined by the time it took the signal to form (a rebound or a breakout of the level). The quicker it is formed, the stronger the signal is.
2) If two or more positions were opened near a certain level based on a false signal (which did not trigger a Take Profit or test the nearest target level), then all subsequent signals at this level should be ignored.
3) When trading flat, a pair can form multiple false signals or not form them at all. In any case, it is better to stop trading at the first sign of a flat movement.
4) Trades should be opened in the period between the start of the European session and the middle of the US trading hours when all positions must be closed manually.
5) You can trade using signals from the MACD indicator on the 30-minute time frame only amid strong volatility and a clear trend that should be confirmed by a trendline or a trend channel.
6) If two levels are located too close to each other (from 5 to 15 pips), they should be considered support and resistance levels.
On the chart:
Support and Resistance levels are the levels that serve as targets when buying or selling the pair. You can place Take Profit near these levels.
Red lines are channels or trend lines that display the current trend and show in which direction it is better to trade now.
The MACD indicator (14, 22, and 3) consists of a histogram and a signal line. When they cross, this is a signal to enter the market. It is recommended to use this indicator in combination with trend patterns (channels and trendlines).
Important announcements and economic reports that can be found on the economic calendar can seriously influence the trajectory of a currency pair. Therefore, at the time of their release, we recommend trading as carefully as possible or exiting the market in order to avoid sharp price fluctuations.
Beginners on Forex should remember that not every single trade has to be profitable. The development of a clear strategy and money management is the key to success in trading over a long period of time.


