Long positions on EUR/USD:
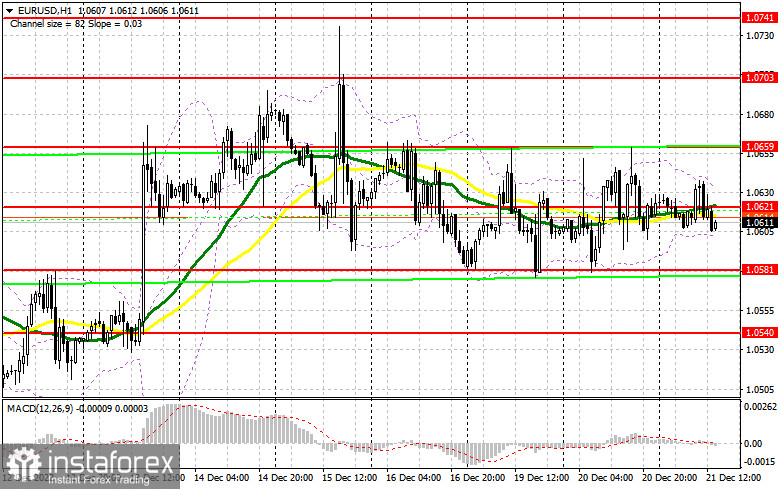
Investors are expecting quite interesting data in the afternoon, which might lead to a sharper movement of the pair. However, much will depend on the US consumer confidence indicator. This index may fall in November, which is likely to make the buyers of the US dollar loosen their grip and take the EUR/USD pair back to the middle of the sideways channel. If the report beats the economists' forecasts and the US Existing Home Sales indicator shows more or less strong figures, the euro may plunge deeper. In that case, only a false breakout near the lower boundary of the sideways channel at 1.0581 may create a buy signal, counting on the rise to 1.0621. A breakthrough and a downward test of this level may strengthen the bulls' positions, allowing them to drag the price to the upper boundary of the channel at 1.0659. Piercing this level, the pair may start a new uptrend, opening the way to 1.0703. If the level of 1.0703 is broken through, the euro may climb to the next target at 1.0741, where traders may lock in profits. If the EUR/USD pair declines during the North American session and we see weak activity from bulls at 1.0581, which is unlikely, the pressure on the euro may increase. This may trigger some bulls' Stop Loss orders, who expect the pair to grow at the end of the year. In this case, a false breakout at the support of 1.0540 may create a buy signal. One may open long positions on a rebound from 1.0495 or lower the low of 1.0445, allowing an upward intraday correction of 30-35 pips.
Short positions on EUR/USD:
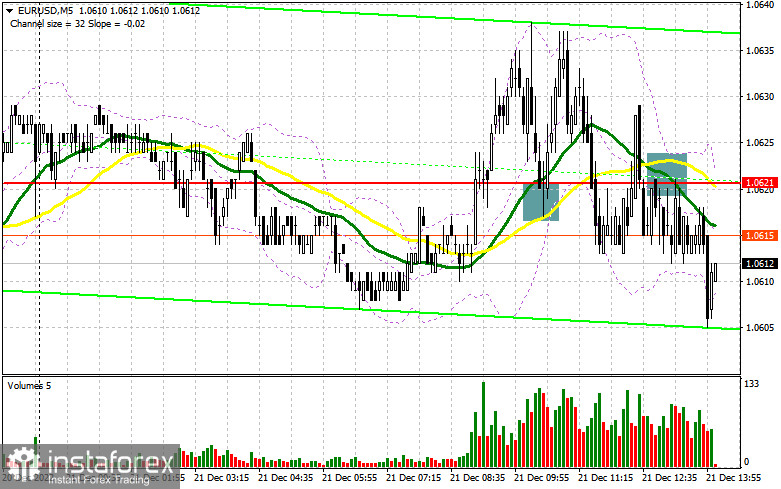
Bears are trying to push the price to the lower boundary of the channel, but everything will depend on the fundamental factor and traders' activity. If the US data turns out to be weak, they will have to protect the middle of the channel of 1.0621, from which the euro has already fallen once today. Only a false breakout at this level may give an additional entry point into short positions, with the aim to decline to the major support at 1.0581. If the price settles below this level, making a downward test of it, is likely to give an additional signal. In this case, bulls' Stop Loss orders may be triggered and the euro is likely to drop to 1.0540. Following this scenario, the market will change in favor of bears. The next target is located at 1.0495, where bulls will show their activity again and try to buy the cheaper euro. However, if the EUR/USD pair soars during the North American session and bears are not active at 1.0621, they may lose the moment. Bulls will have a good chance to hit new highs near 1.0659. It would be better to sell the pair from this level only after a false breakout. Short positions on the euro may be opened from the high of 1.0703, allowing a downward correction of 30-35 pips.

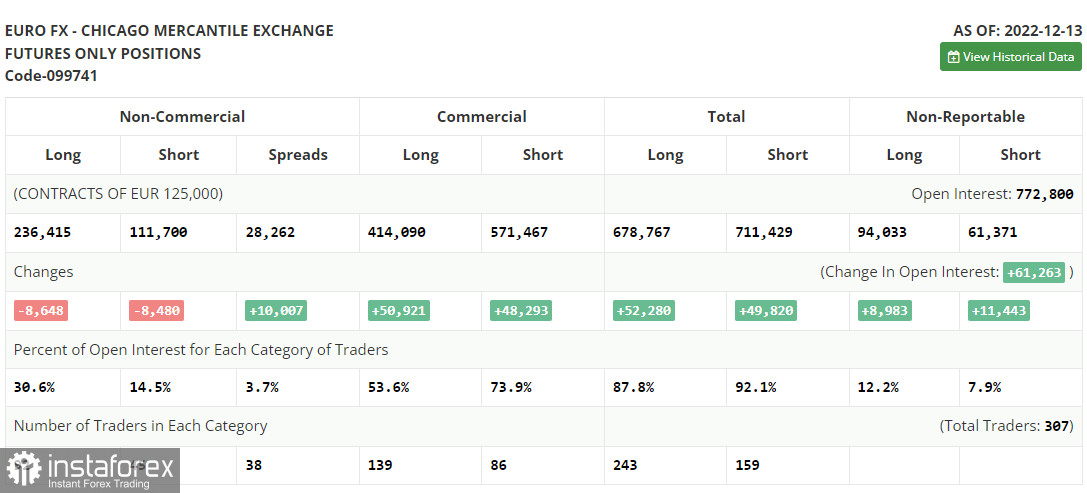
The COT report for December 13 logged a decrease in both long and short positions. Many preferred to lock in profits before last week's global central banks' meetings, which led to a reduction in positions. Obviously, the hawkish policies signaled that the Fed and the ECB would continue to affect the growth prospects for risky assets. Eventually, regulators' battle against inflation may lead to a recession in both the USA and Europe. The focus is now shifting to next year, as nothing interesting will happen in December and the markets are unlikely to show anything out of the ordinary. The COT report indicates that long non-commercial positions fell by 8,648 to 236,415, while short non-commercial positions declined by 8,480 to 111,700. At the end of the week, the total non-profit net positioning was down slightly to 122,247 against 123,113. This indicates that investors keep the balance and despite the lack of purchases, no one is in a hurry to dump risky assets even at the current prices. The euro needs support from new fundamental data to continue growth. The weekly closing price rose to 1.0342 against 1.0315.

Indicators' signals:
Moving averages
The pair is trading near the 30- and 50-day moving averages, indicating that the pair is moving sideways.
Note: The period and prices of the moving averages are considered by the author on the hourly chart H1 and differ from the general definition of the classic daily moving averages on the daily chart D1.
Bollinger Bands
If the price increases, the upper band of the indicator near 1.0635 will offer resistance.
Description of indicators
- A moving average defines the current trend by smoothing out market volatility and noise. Period 50. Marked in yellow on the chart.
- A moving average defines the current trend by smoothing out market volatility and noise. Period 30. Marked in green on the chart.
- MACD (Moving Average Convergence/Divergence) indicator. Fast EMA 12. Slow EMA 26. SMA 9
- Bollinger Bands. Period 20
- Non-commercial traders are speculators, such as individual traders, hedge funds and large institutions, which use the futures market for speculative purposes and meet certain requirements.
- Long non-commercial positions represent the total long open position of non-commercial traders.
- Short Noncommercial positions represent the total short open position of noncommercial traders.
- Total non-commercial net position is the difference between short and long positions of non-commercial traders.


