


EUR/USD
Larger timeframes
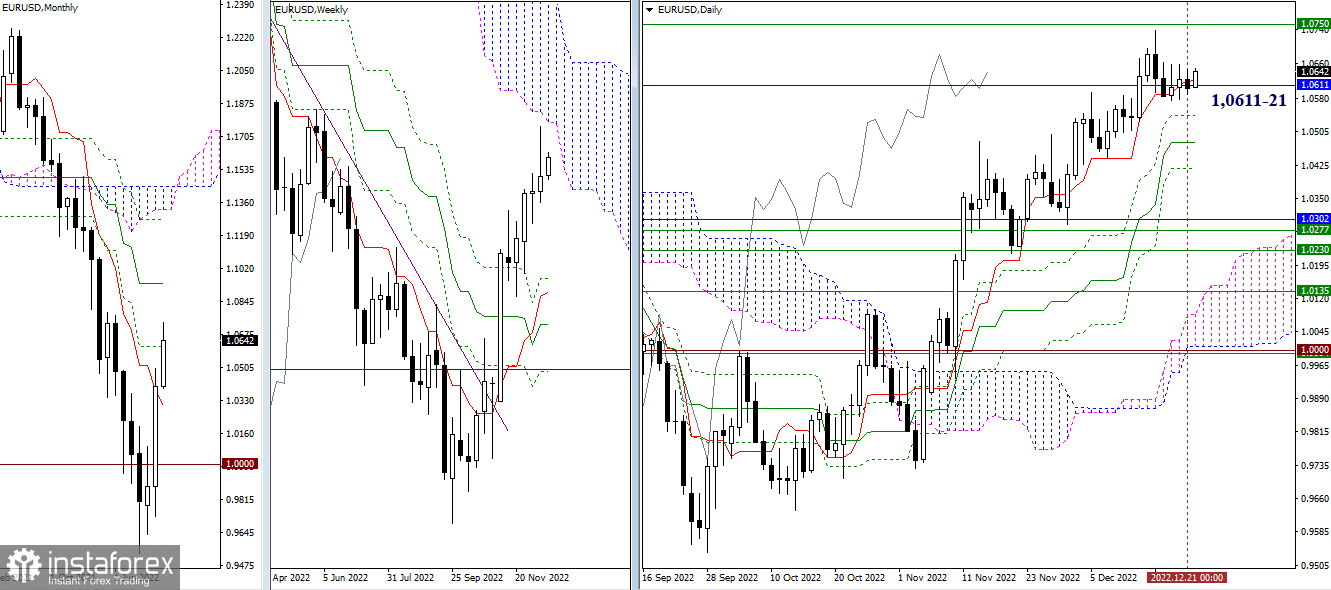
The currency pair is still in a consolidation stage. The monthly (1.0611) and daily (1.0621) levels are exerting their influence and are keeping the price inside a range. Outlook, expectations, and location of other important technical levels remain the same. The nearest resistance is seen at 1.0750, the lower border of the weekly cloud whereas support embraces the area of 1.0540 – 1.0480 – 1.0419 which represent the levels of the daily Gold Cross.
H4 – H1
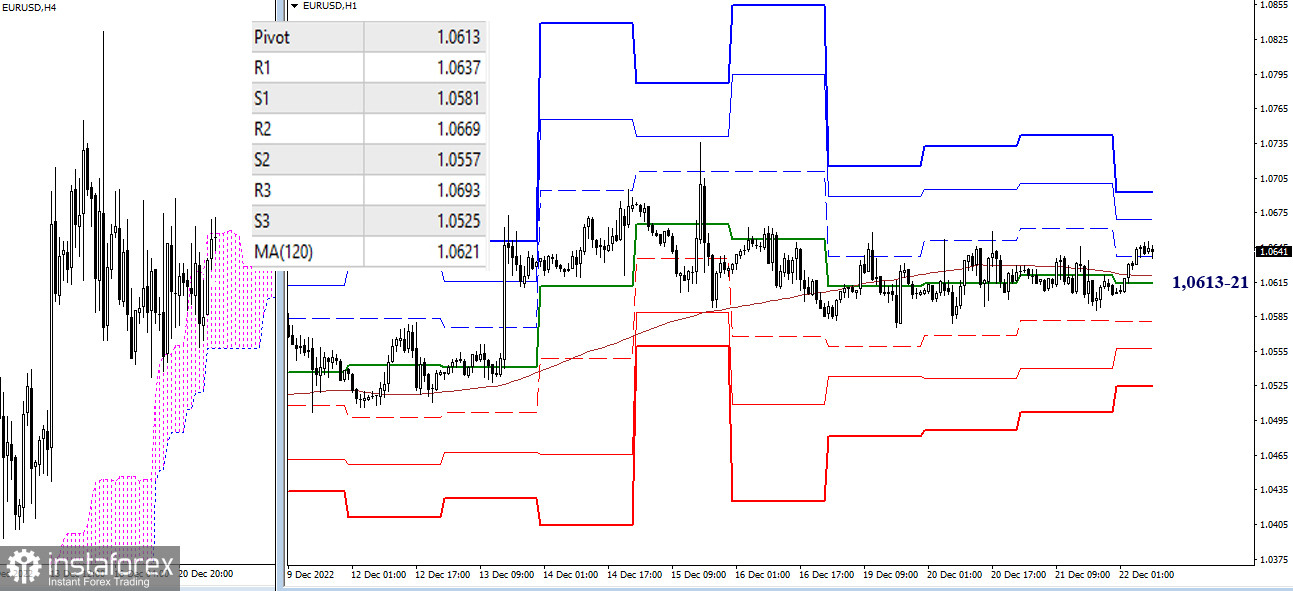
The key levels of the smaller timeframes now coincide with 1.0613-21, the gravity center of the intraday consolidation. This area matches the central pivot point + weekly long-term trend line. We should bear in mind the following important ideas. If the price settles above or below the key levels, it consequently will reinforce that particular level. If the price settles above 0.0611-21, the bulls will take advantage. Conversely, if the price settles below that zone, this will increase the bearish sentiment. If case the price escapes from the gravity zone and in case the key levels are shifted, this will enable traders to revise the outlook for EUR/USD for the medium and long term.
***
GBP/USD
Larger timeframes
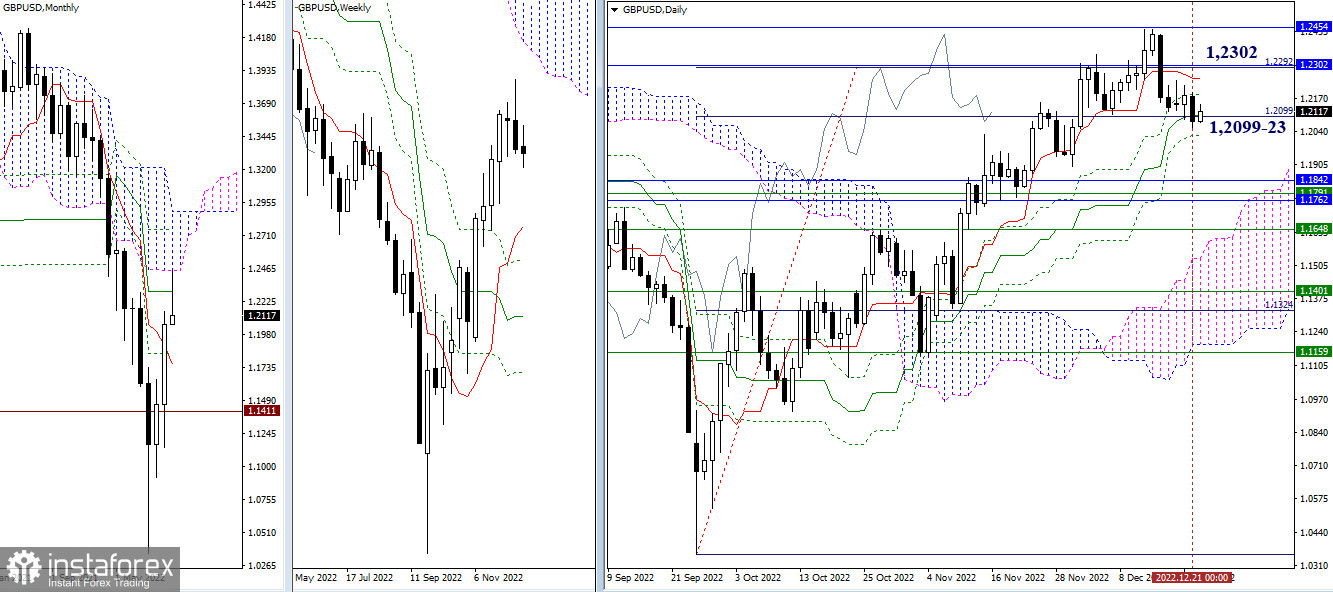
The GBP bears pointed to a new intraday low and closed the pair below the intraday levels of 1.2184 – 1.2099. Their next goal is to destroy the daily Gold Cross whose highest level is now located at 1.2023. Once it is reached, traders will shift focus towards 1.1842 – 1.1762, the area where supports of various timeframes are clustered. The nearest upside targets for today remain at the same level of 1.2302 (one-month medium-term trend line + intraday short-term trend line) and at 1.2454 (the lower border of the one-month cloud).
H4 – H1
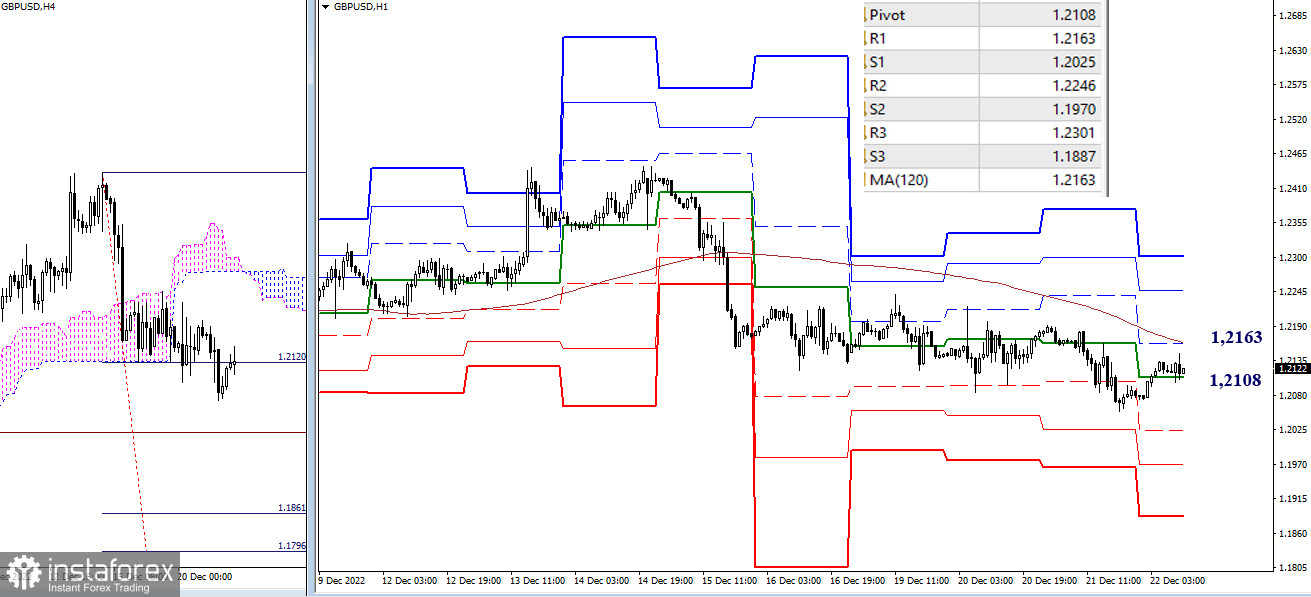
On smaller timeframes, the bears are ruling the market. The instrument is expected to decline to support of classic pivot levels (1.2025 – 1.1970 – 1.1887). Apart from them, we may consider 1.1861 – 1.1796, another target area where the H4 cloud could be broken. Notably, the key levels of smaller timeframes now serve as resistance. So, if the price settles above 1.2163 (a one-week long-term trend line), this might change the current balance of trading forces and trading sentiment.
***
This technical analysis is based on the following ideas:
Larger timeframes - Ichimoku Kinko Hyo (9.26.52) + Fibo Kijun levels
H1 – classic pivot points + 120-period Moving Avarage (weekly long-term trendline)


