


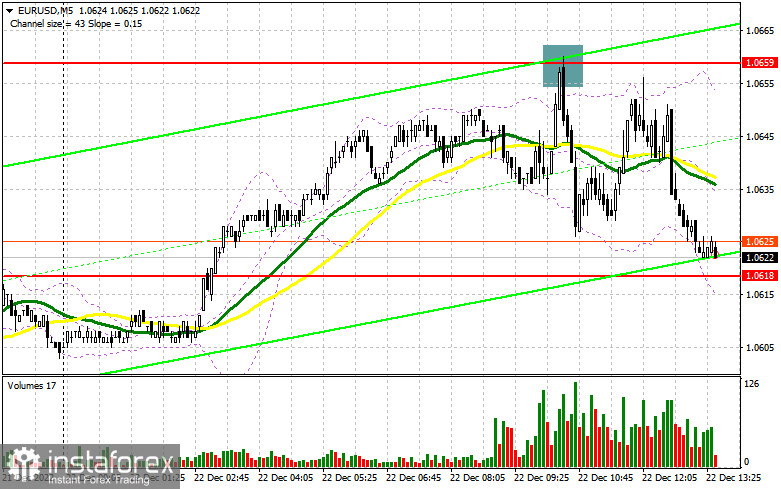
In the morning article, I turned your attention to 1.0659 and recommended making decisions with this level in focus. Now, let's look at the 5-minute chart and figure out what actually happened. Bulls failed to push the pair above the weekly highs as the economic calendar remained empty. A rise and a false breakout of 1.0659 created an excellent sell signal. The pair declined by about 40 pips. For the second half of the day, the technical outlook has not been revised as well as the trading strategy.
When to open long positions on EUR/USD:
In the American session, the US GDP figures and initial jobless claims data are due. However, these reports will hardly stir market activity. The GDP reading is likely to remain unchanged. As for the labor market report, traders priced it in a long time ago, especially amid the expectations of further rate increases. For this reason, it is better to open positions if the pair declines from the middle of the sideways channel. A false breakout of 1.0618 will give a good buy signal with the prospect of a return to 1.0659. Only a breakout and a downward retest of this level along with weak US data could help bulls cement an upward movement. They may push the pair to a new weekly high of 1.0702. A breakout of this level will also allow buyers to build a new uptrend. Thus, the pair is likely to approach 1.0740. If so, it could soar to a monthly high of 1.9772 where I recommend locking in profits. If EUR/USD declines during the American session and bulls show no activity at 1.0618, it will hardly undermine the bullish sentiment. The pressure on the euro may increase, which may force bulls to close some of their Stop Loss orders. In this case, only a false breakout of 1.0581, which is located near the lower border of the side channel, will give a bug signal. You could buy EUR/USD immediately at a bounce from 1.0540 or lower at 1.0495, keeping in mind an upward intraday correction of 30-35 pips.
When to open short positions on EUR/USD:
Sellers are still controlling the upper border of the sideways channel and are now aiming at its middle. Everything will depend on macro stats and the market reaction. In case of weak data, bears need to take control of 1.0659. So far, bears have pushed the pair to the target levels without obstacles. Only a false breakout there could provide additional entry points into short positions with the prospect of a decline to the support level of 1.0618. A breakout below as well as an upward retest will give a sell signal. Bulls will have to close Stop Loss orders. The euro could fall to 1.058. at this level, buyers who are defending the lower border will enter the market. A more distant target will be the 1.0540 level where I recommend locking in profits. If EUR/USD rises during the US session and bears show no energy at 1.0659, sellers may lose momentum. Buyers will get a good chance to push the price to a high of 1.0703. I would advise you to open short positions there only after a false breakout takes place. You could sell EUR/USD at a bounce from a high of 1.0741, keeping in mind a downward intraday correction of 30-35 pips.
COT report
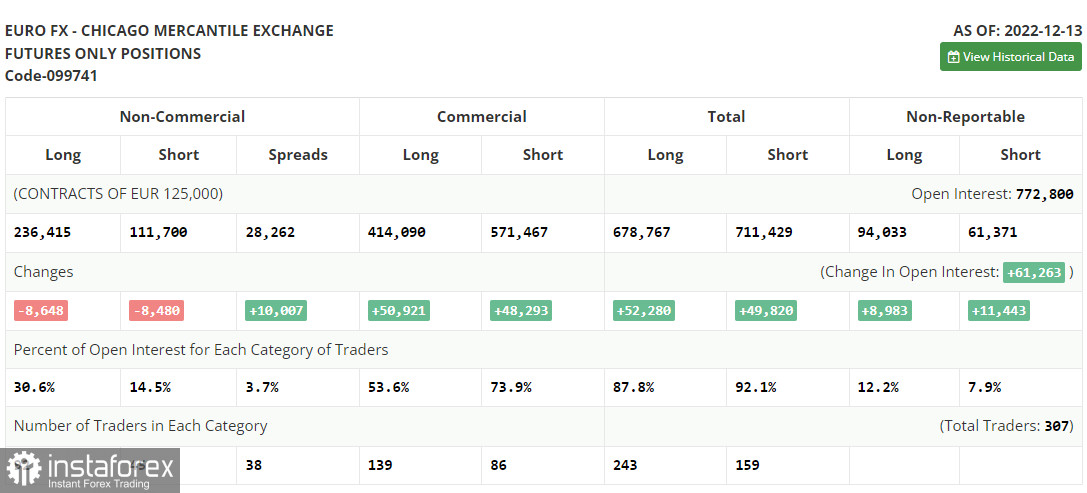
According to the COT report from December 13, the number of both long and short positions dropped. Most traders decided to lock in profits before the meetings of the global central banks, which were held last week. This, in turn, led to a decline in the volume of positions. It is obvious that the hawkish policy chosen by the Fed and the ECB will continue to affect the growth of risk assets. The fact is that the intention of the central banks to combat inflation may lead to a recession in both the US and Europe. The COT report unveiled that the number of long non-commercial positions decreased by 8,648 to 236,415, whereas the number of short non-commercial positions dropped by 8,480 to 111, 700. At the end of the week, the total non-commercial net position became slightly smaller and amounted to 122,247 against 123,113. This indicates that investors remain balanced. Although they avoid buying the euro at the moment, they are not in a hurry to sell risky assets even at the current prices. A new fundamental reason is needed for further growth in the euro. The weekly closing price rose to 1.0342 from 1.0315.
Indicators' signals:
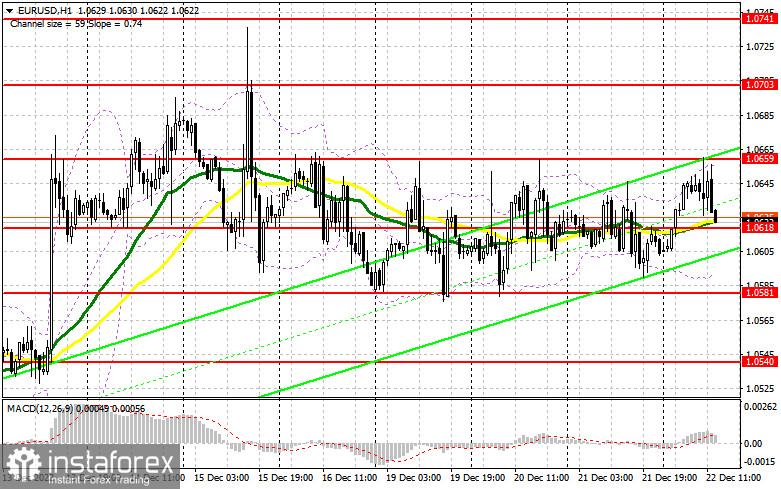
Trading is carried out near the 30 and 50 daily moving averages. It indicates a sideways movement of the pair.
Moving averages
Note: The period and prices of moving averages are considered by the author on the H1 (1-hour) chart and differ from the general definition of the classic daily moving averages on the daily D1 chart.
Bollinger Bands
If EUR/USD rises, the indicator's upper border at 1.0659 will serve as support.
Description of indicators
- Moving average (moving average, determines the current trend by smoothing out volatility and noise). Period 50. It is marked yellow on the chart.
- Moving average (moving average, determines the current trend by smoothing out volatility and noise). Period 30. It is marked green on the chart.
- MACD indicator (Moving Average Convergence/Divergence — convergence/divergence of moving averages) Quick EMA period 12. Slow EMA period to 26. SMA period 9
- Bollinger Bands (Bollinger Bands). Period 20
- Non-commercial speculative traders, such as individual traders, hedge funds, and large institutions that use the futures market for speculative purposes and meet certain requirements.
- Long non-commercial positions represent the total long open position of non-commercial traders.
- Short non-commercial positions represent the total short open position of non-commercial traders.
- Total non-commercial net position is the difference between the short and long positions of non-commercial traders.


