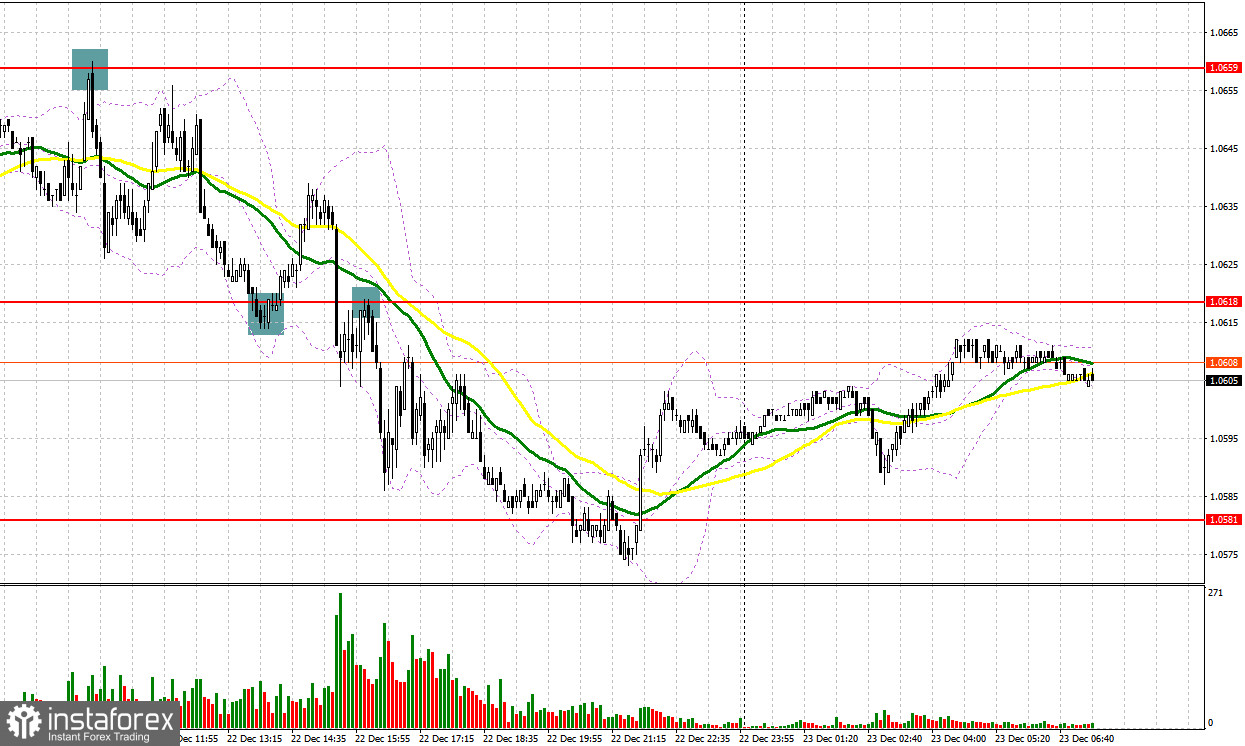
Yesterday, a few entry signals were created. Let's take a look at the M5 chart to get a picture of what happened. In the previous review, we focused on the mark of 1.0659 and considered entering the market there. The bulls failed to break through weekly lows. Growth and a false breakout through the level generated a sell signal. The quote went down by about 50 pips and encountered support at 1.0618. A false breakout through this level generated a buy signal. The quote retraced up by about 25 pips. The pair felt an increase in pressure. A breakout and retest of 1.0618 made a sell entry point. The pair went down by 40 pips.

When to go long on EUR/USD:
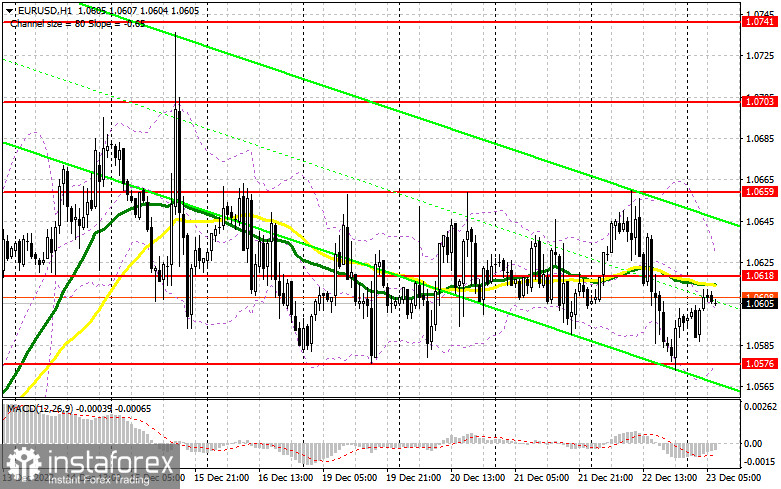
Pressure on the pair mounted following the release of revised data on Q3 US GDP. In the course of the North American session, the quote reached the channels' lower limit at 1.0576. Today, the pair returned to the middle of the channel seen at 1.0618 in the course of the Asian session. The market is likely to trade coolly in the first half of the day due to an empty macroeconomic calendar in the eurozone. It will become possible to go long after a false breakout in the area of the channels' lower limit at 1.0576. This will create a buy signal, allowing the bulls to get to 1.0618, the barrier limiting the pair's upside potential. This is where the bearish MAs are also located. An additional buy signal will be created after a breakout and a downside retest of the barrier. The price may then soar to the high of 1.0659. A breakout through the level will trigger a row of bearish stop orders and generate another buy signal, targeting 1.0703. If the pair tests it, an uptrend will begin. This is where it is wiser to lock in profits. Should EUR/USD go down when there is no bullish activity at 1.0576, the pressure on the pair will increase, and the quote will drop to 1.0535 where long positions could be opened after a false breakout. It will become possible to buy EUR/USD on a rebound from 1.0495 or 1.0446, allowing a bullish correction of 30 to 35 pips intraday.
When to go short on EUR/USD:
Bearish activity is likely to increase near the resistance level of 1.0618. It is important that the bears do not lose control over the barrier. The empty macroeconomic calendar in the eurozone should limit the pair's growth potential. For that reason, short positions could be considered after a false breakout through 1.0618. This will lead to a fall in price to the channel's lower limit at 1.0576. The pressure on the quote will increase after a breakout and a retest of the barrier, generating an additional sell signal. The quote may then retrace down to 1.0535 where the bears are likely to loosen their grip on the market. The pair will fall to 1.0495 if it consolidates below this mark. This will indicate a high probability of a bear market at the end of the year. The most distant target is seen at 1.0445 where it is wiser to lock in profits. If EUR/USD goes up during the European session when there is no bearish activity at 1.0618, short positions could be considered only after a false breakout through the channel's upper limit at 1.0659. Also, it will be possible to sell EUR/USD on a rebound from the high of 1.0703, allowing a bearish correction of 30 to 5 pips.

Commitments of Traders:
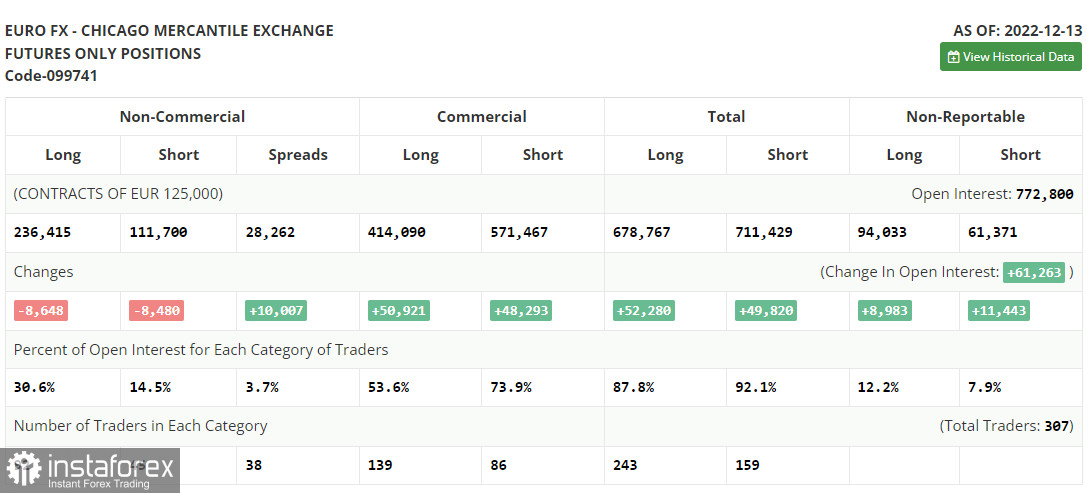
The COT report for December 13 revealed a drop in long and short positions. Last week, traders preferred locking in profits before the meetings of world central banks. Consequently, it led to a reduction in the number of positions. The Fed's and the ECB's hawkish stance on monetary policy will continue limiting growth prospects for risky assets. The regulators' fight against persistent inflation may trigger a recession in the US and the eurozone. The focus is now shifting to next year, as markets are unlikely to surprise traders in December. According to the COT report, long non-commercial positions fell by 8,648 to 236,415, short non-commercial positions declined by 8,480 to 111,700, and the total non-profit net positioning dropped to 122,247 from 123,113. This indicates that investors are reluctant to dispose of risky assets at the current price even despite the subdued bullish activity. The pair needs support from new fundamental factors to extend growth. The weekly closing price rose to 1.0342 from 1.0315.

Indicator signals:
Moving averages
Trading is carried out in the range of the 30-day and 50-day moving averages, indicating a sideways trend.
Note: The period and prices of moving averages are viewed by the author on the hourly chart and differ from the general definition of classic daily moving averages on the daily chart.
Bollinger Bands
- Resistance stands at 1.0630, in line with the upper band. Support is seen at 1.0575, in line with the lower band.
- Indicator description:
- Moving average (MA) determines the current trend by smoothing volatility and noise. Period 50. Colored yellow on the chart.
- Moving average (MA) determines the current trend by smoothing volatility and noise. Period 30. Colored green on the chart.
- Moving Average Convergence/Divergence (MACD). Fast EMA 12. Slow EMA 26. SMA 9.
- Bollinger Bands. Period 20
- Non-commercial traders are speculators such as individual traders, hedge funds, and large institutions who use the futures market for speculative purposes and meet certain requirements.
- Long non-commercial positions are the total long position of non-commercial traders.


