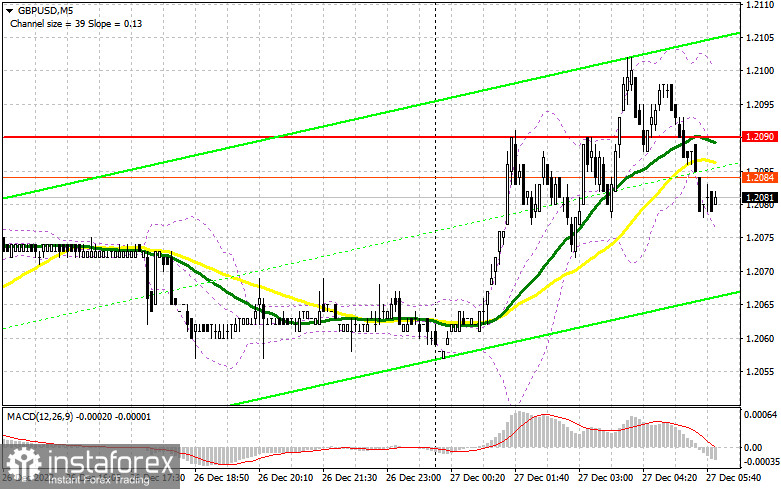
Yesterday there were no signals to enter the market. Let's look at the 5-minute chart and figure out what happened. Due to low volatility, we never reached the levels I mentioned, and so we failed to get good entry points for entering the market.

When to open long positions on GBP/USD:
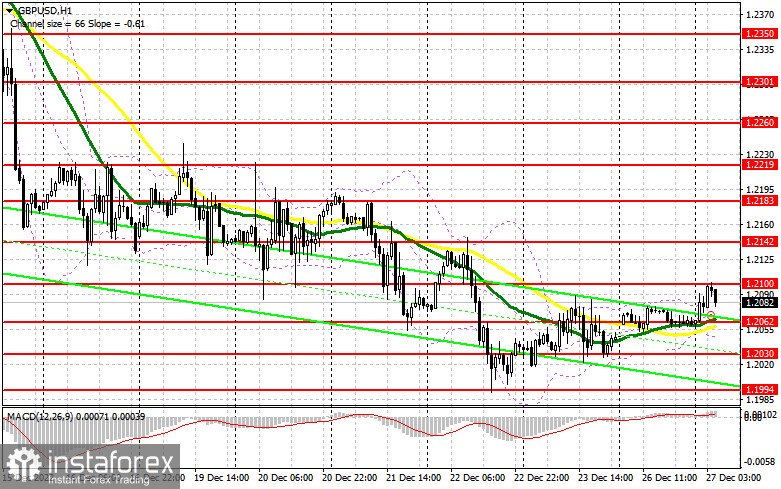
After the Christmas holidays, today should be a bit more volatile, but I don't think we will see super high spikes of volume at the end of the year, especially amid the lack of fundamental UK data. I expect bulls to continue the correction after the pound fell last week. At the moment, it would be best to open long positions if a false breakout takes place near the new support level of 1.2062, which was formed yesterday. At this level, the moving averages are benefiting bulls. The pair could return 1.2100, which acts as the resistance level that appeared in today's Asian session. A breakout above this level and the lack of UK data may push the pair to 1.2142, where the bears will enter the market. A breakout above 1.2142 with a similar downward test will help the pair to approach 1.2183, where I recommend locking in profit. If the pair fails to reach 1.2062, I would advise you to postpone longs until a false breakout of a low of 1.2030 takes place. I recommend to buy GBP/USD on the rebound from 1.1949, keeping in mind an upward intraday correction of 30-35 pips.
When to open short positions on GBP/USD:
The bullish correction is coming to an end and if bears are not active today and don't regain control over 1.2062, the market can turn away from them. In the current situation, only a false breakout around the new resistance of 1.2100 will give a good sell signal. If so, the bears will assert strength. The pair may fall to a new low of 1.2062. Only a breakout and an upward retest will provide a sell signal with the prospect of a movement to 1.2030 as well as a return to the December low. A more distant target will be 1.1994, where I recommend locking in profit. If GBP rises and bears show no energy at 1.2100, the pressure on the pound will weaken significantly. The bulls will get an excellent opportunity to start a correction. In this case, only a false breakout of 1.2142 will give an entry point into short positions. If bears are not active there either, you could sell GBP/USD immediately at the bounce from a high and 1.2183, keeping in mind a downward intraday correction of 30-35 pips.

COT report:
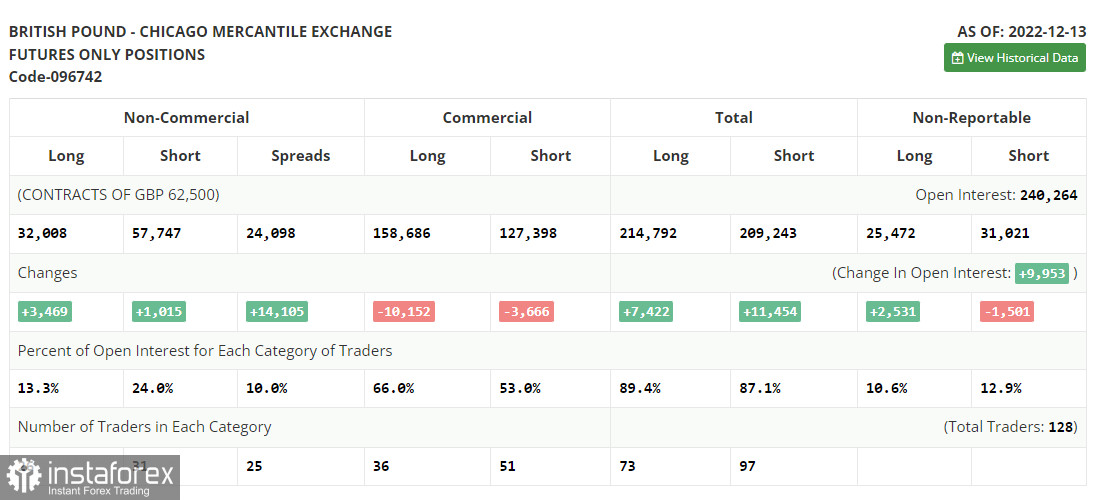
The COT report for December 13th logged a rise in long and short positions. Given that the number of long positions is higher, it means that the bullish sentiment is strong now. Traders are ready to buy the pair at the current highs. Last week, the Bank of England announced that it would remain committed to aggressive tightening to curb stubbornly high inflation, which slowed down a bit last month. However, many analysts warn that the regulator's decision to stick to a hawkish stance may trigger a recession. It is sure to limit the pair's upside potential. For this reason, it is better to wait for a downward correction in order to buy the instrument. According to the latest COT report, short non-commercial positions rose by 1,015 to 57,747 and long non-commercial positions grew by 3,469 to 32,008. Consequently, the non-commercial net position came in at -25,739 versus -28,193 a week ago. The weekly closing price of GBP/USD increased to 1.2377 versus 1.2149.

Indicators' signals:
Trading is carried out near the 30 and 50 daily moving averages. It indicates that the pair is moving sideways.
Moving averages
Note: The period and prices of moving averages are considered by the author on the H1 (1-hour) chart and differ from the general definition of the classic daily moving averages on the daily D1 chart.
Bollinger Bands
If GBP/USD rises, the indicator's upper limit at 1.2090 will serve as resistance.
Description of indicators
- Moving average (moving average, determines the current trend by smoothing out volatility and noise). Period 50. It is marked yellow on the chart.
- Moving average (moving average, determines the current trend by smoothing out volatility and noise). Period 30. It is marked green on the chart.
- MACD indicator (Moving Average Convergence/Divergence - convergence/divergence of moving averages) Quick EMA period 12. Slow EMA period to 26. SMA period 9
- Bollinger Bands (Bollinger Bands). Period 20
- Non-commercial speculative traders, such as individual traders, hedge funds, and large institutions that use the futures market for speculative purposes and meet certain requirements.
- Long non-commercial positions represent the total long open position of non-commercial traders.
- Short non-commercial positions represent the total short open position of non-commercial traders.
- Total non-commercial net position is the difference between the short and long positions of non-commercial traders.


