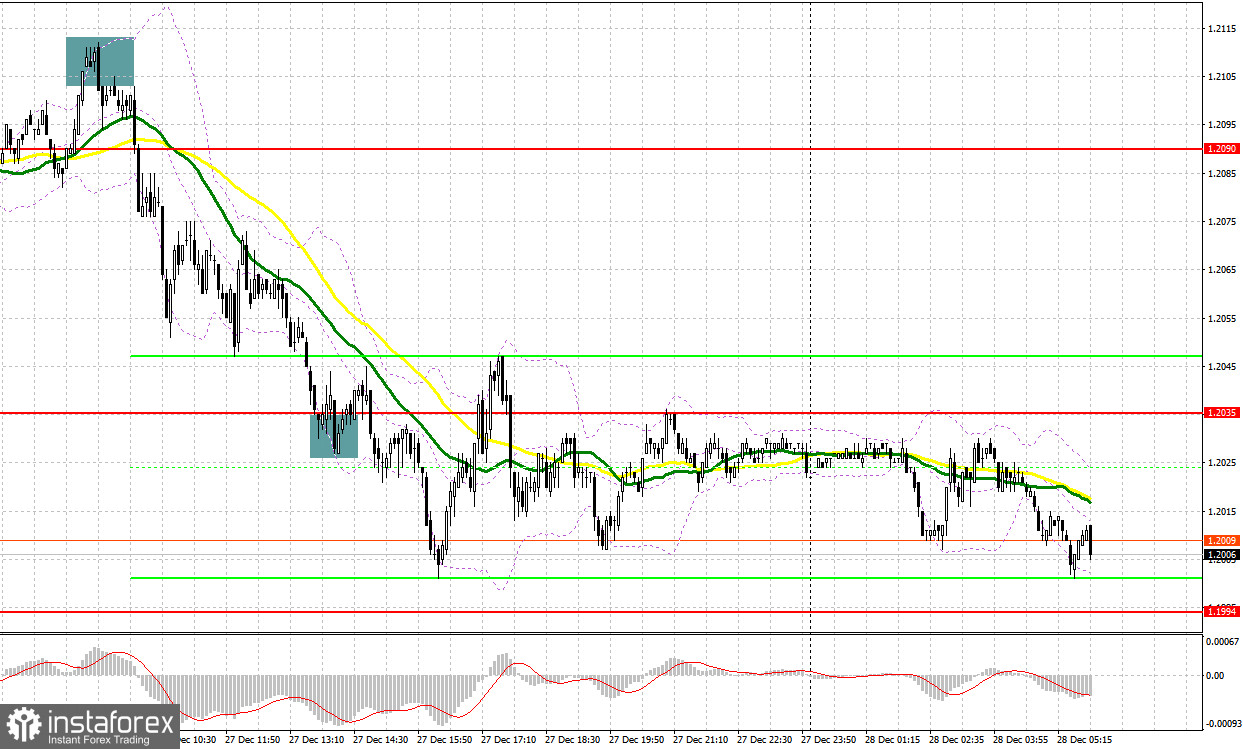
Yesterday, several signals for entering the market were formed. Let's analyze the 5-minute chart to determine what transpired. I focused on the level of 1.2100 in my morning forecast and suggested making decisions about entering the market there. After the upward correction seen in recent days, the growth and formation of a false breakout at 1.2100 provided an excellent signal to sell the pair. The pound fell to around 1.2062 as a result of the downward movement, which totaled more than 50 points. There was a false breakdown that formed, which resulted in a buy signal but no growth. I moved support to 1.2035 in the second half of the day, but even there, a false breakdown that formed a buy signal did not result in a powerful rebound up.

To open long positions on GBP/USD, you need:
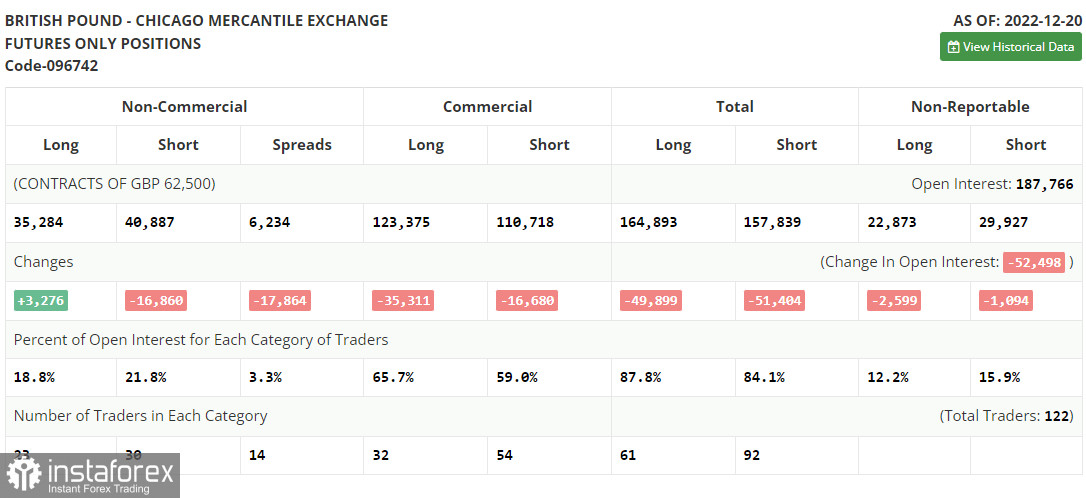
Let's examine what transpired in the futures market before looking at the technical picture of the pound. There were more long positions and fewer short ones in the COT report (Commitment of Traders) for December 20. It was made clear after important central bank meetings that regulators would keep raising interest rates and tightening monetary policy, which by all logic should increase demand for national currencies, including the British pound. The report makes it clear exactly how things stand. However, traders are unlikely to continue buying the pound with the same zeal in January, given that GDP data for the UK's third quarter were revised in the direction of a larger decrease, and the start of the recession is not an expectation for next year, but rather a reality this year. According to the most recent COT report, long non-commercial positions increased by 3,276 to a level of 35,284 while short non-commercial positions decreased by 16,860 to a level of 40,887. As a result, the non-commercial net position's negative value decreased to -5,603 from -25,739 the previous week. In comparison with 1.2377, the weekly closing price dropped to 1.2177.

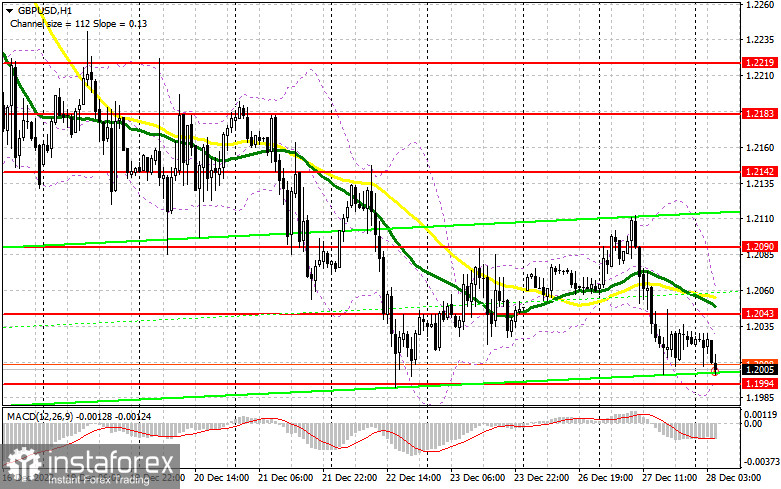
Today appears to be quite calm, but the sellers of the pound now have the upper hand because they completed their tasks flawlessly yesterday and are now concentrating on updating the monthly minimum. I anticipate a further sell-off of the pound if the bears can breach the 1.1994 support level, which has recently been put to the test. Because of this, I do not suggest that you rush into taking on long positions. Only a false breakdown at 1.1994 will trigger a buy signal and establish the existence of buyers of the pound in the market at year's end, allowing them to move back to 1.2043 - the middle of the side channel, where the moving averages are on the sellers' side. Without this level, buyers of the GBP/USD will find it challenging to predict the development of an upward correction. The breakdown of 1.2043 along with the reverse test from top to bottom will pave the way to 1.2090, where I advise fixing profits, and only after getting higher can we talk about continued growth. The area around 1.2142 will be the farthest target, which will cause a sizable amount of sellers to capitulate, but this is something out of a work of fiction. The market will become unbalanced if GBP/USD declines and there are no buyers at 1.1994; the bears will then continue to drive the pound lower. If this happens, I recommend delaying long positions until 1.1949. I suggest only making purchases based on a fictitious breakdown. To correct 30-35 points within a day, it is possible to open long positions on the GBP/USD immediately for a rebound from 1.1904.
To open short positions on GBP/USD, you need:
The market is still under the control of the bears, and they will likely continue to do so today. They will rely on a break below 1.1994 in the first half of the day to accomplish this. However, it would be nice to protect 1.2043, a new resistance formed by yesterday's results, which will allow them to demonstrate their presence in the market before we expect the downward trend to continue. Additionally, moving averages are on their side. Only a false breakdown at 1.2043 that results in a decline of the pair to its closest support level of 1.1994 constitutes a sell signal in the case of an increase in the GBP/USD. With the update of the 1.1949 minimum, a breakout and a reverse test from the bottom up of this range will provide an entry point for sales and put more pressure on the pound. The 1.1904 regions will be a further target, and that's where I suggest setting profits. When buyers enter the market, the pair will remain in the side channel with the possibility of GBP/USD growth and the absence of bears at 1.2043, which will cause a jerk of GBP/USD to the vicinity of 1.2090. In anticipation of a new downward movement of the pair, short positions can be entered if there is a false breakout at this level. If nothing happens, there might be a jump up to 1.2142. There, I suggest that you sell GBP/USD right away in anticipation of a rebound, anticipating that the pair will decline by 30-35 points within a day.

Signals from indicators
Moveable Averages
The fact that trading is taking place below the 30 and 50 moving averages suggests that bears are trying to exert pressure on the pair.
Note that the author's consideration of the period and costs of moving averages on the hourly chart H1 differs from the standard definition of the traditional daily moving averages on the daily chart D1.
Bands by Bollinger
A new wave of pound growth will begin if the indicator's upper limit in the vicinity of 1.2043 is broken. The pressure on the pair will increase if the lower limit of 1.1994 is broken.
Description of indicators
- Moving average (moving average determines the current trend by smoothing out volatility and noise). Period 50. The graph is marked in yellow.
- Moving average (moving average determines the current trend by smoothing out volatility and noise). Period 30. The graph is marked in green.
- MACD indicator (Moving Average Convergence / Divergence - moving average convergence/divergence) Fast EMA period 12. Slow EMA period 26. SMA period 9
- Bollinger Bands (Bollinger Bands). Period 20
- Non-profit speculative traders, such as individual traders, hedge funds, and large institutions use the futures market for speculative purposes and to meet certain requirements.
- Long non-commercial positions represent the total long open position of non-commercial traders.
- Short non-commercial positions represent the total short open position of non-commercial traders.
- Total non-commercial net position is the difference between the short and long positions of non-commercial traders.


