


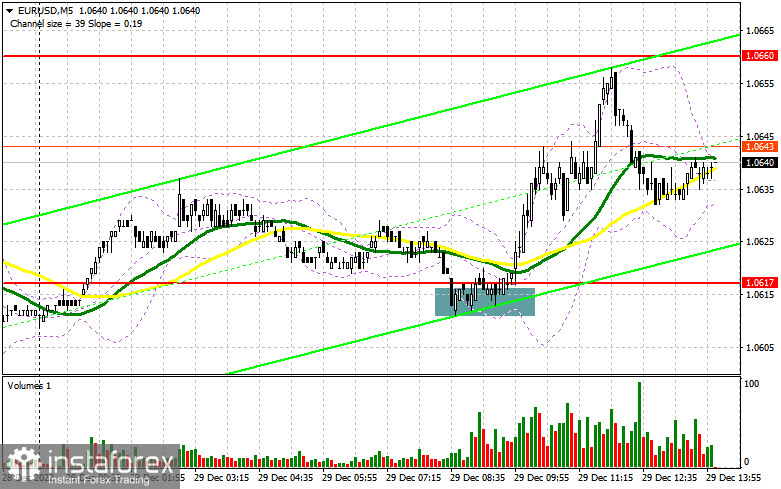
In the morning article, I turned your attention to 1.0617 and recommended making decisions with this level in focus. Now, let's look at the 5-minute chart and figure out what actually happened. A drop and a false breakout of 1.0617, which acts as the middle of the sideways range, occurred amid the empty economic calendar and the low volatility. It created entry points into long positions. The EUR/USD pair grew by more than 30 pips but failed to test 1.0660. For the afternoon, the outlook remained unchanged.
When to open long positions on EUR/USD:
Today, the weekly initial jobless claims report is due. However, traders are likely to ignore it. For this reason, it is better to make trading decisions based on technical analysis. As in the morning, I would advise you to go long if a false breakout of 1.0617 takes place. It could give a buy a signal as a similar situation happened yesterday. Bulls may push the pair to 1.0660 which the pair has tried to approach many times this week. A breakout and a downward retest of this level will offer an additional buy signal with the prospect of a jump to a high of 1.0703. A breakout of this level will also force bears to close Stop Loss orders and give a buy signal. The pair may rise to 1.0741. The test of this level could lead to the formation of an uptrend at the end of the year. I recommend locking in profits there. If EUR/USD declines and buyers show no activity at 1.0617 in the afternoon, the pressure on the pair will return. Sellers are sure to regain the upper hand. If so, the pair is expected to decrease to 1.0576. I would advise you to open long positions there only after a false breakout. You could buy EUR/USD immediately at a bounce from 1.0535 or lower at 1.0495, keeping in mind an upward intraday correction of 30-35 pips.
When to open short positions on EUR/USD:
If you are holding short positions on the euro, it is better to stick to the previous scenario. By no means should bears allow an increase of the pair above 1.0660 at the end of the year. If so, the pair could approach the December highs. Strong US data may limit the upward potential of the pair. So, a false breakout looks possible. For this reason, it would be wise to open short positions only after a failure to consolidate above 1.0660 by analogy with yesterday's signal, which lead to a drop to 1.0617 - the middle of the sideways channel. A breakout and an upward retest of this level will exert pressure on the euro, providing a sell signal with a correction to 1.0576. At this level, the bears will surely retreat again. A return below this level will result in a large downward movement to1.0535. It will also fuel hopes for cementing the bear trend at the end of the year. A more distant target will be the 1.0495 level where I recommend locking in profits. If EUR/USD rises during the American session and bears show no energy at 1.0660, I would advise you to postpone short positions until a false breakout of 1.0703. You could sell EUR/USD immediately at a bounce from a high of 1.0741, keeping in mind a downward intraday correction of 30-35 pips.
COT report
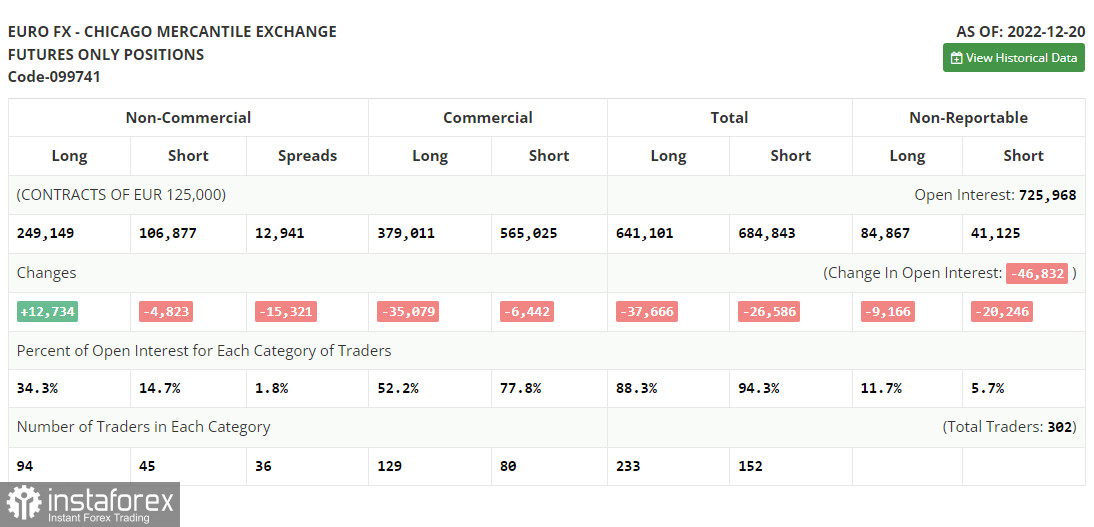
The COT report (Commitment of Traders) for December 20 logged an increase in long positions and a drop in short ones. Traders preferred to go long on the euro after the meetings of central banks by the end of this year, as well as amid positive macro stats from the eurozone and Germany published last week. However, it did not lead to a trend reversal. The pair is still moving in the sideways channel formed last week. Demand for the US dollar remains high amid the upbeat US GDP report for the 3rd quarter and the labor market data. Additionally, traders expect further tightening of monetary policy due to the risks of rising inflation next year. What is more, investors are getting rid of risky assets due to recession corners. The COT report revealed that long non-commercial positions grew by 12,734 to 249,149, while short non-commercial positions fell by 4,823 to 106,877. At the end of the week, the total non-commercial net position increased sharply and amounted to 142,279 against 122,247. It indicates that speculators are still buying the euro despite all the risks as they are anticipating more rate hikes by the ECB next year. But for further good growth of the euro, a new fundamental reason is needed. The weekly closing price rose to 1.0690 against 1.0342. However, the euro needs new drivers to climb higher. The weekly closing price rose to 1.0690 against 1.0342.
Indicators' signals:
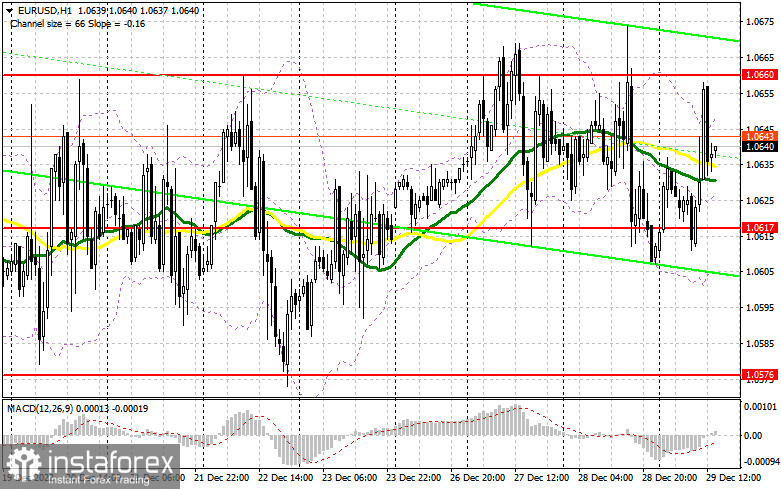
Trading is carried out near the 30 and 50 daily moving averages. It indicates that the pair is moving sideways.
Moving averages
Note: The period and prices of moving averages are considered by the author on the H1 (1-hour) chart and differ from the general definition of the classic daily moving averages on the daily D1 chart.
Bollinger Bands
If EUR/USD climbs, the indicator's upper border at 1.0650 will serve as resistance.
Description of indicators
- Moving average (moving average, determines the current trend by smoothing out volatility and noise). Period 50. It is marked yellow on the chart.
- Moving average (moving average, determines the current trend by smoothing out volatility and noise). Period 30. It is marked green on the chart.
- MACD indicator (Moving Average Convergence/Divergence - convergence/divergence of moving averages) Quick EMA period 12. Slow EMA period to 26. SMA period 9
- Bollinger Bands (Bollinger Bands). Period 20
- Non-commercial speculative traders, such as individual traders, hedge funds, and large institutions that use the futures market for speculative purposes and meet certain requirements.
- Long non-commercial positions represent the total long open position of non-commercial traders.
- Short non-commercial positions represent the total short open position of non-commercial traders.
- Total non-commercial net position is the difference between the short and long positions of non-commercial traders.


