


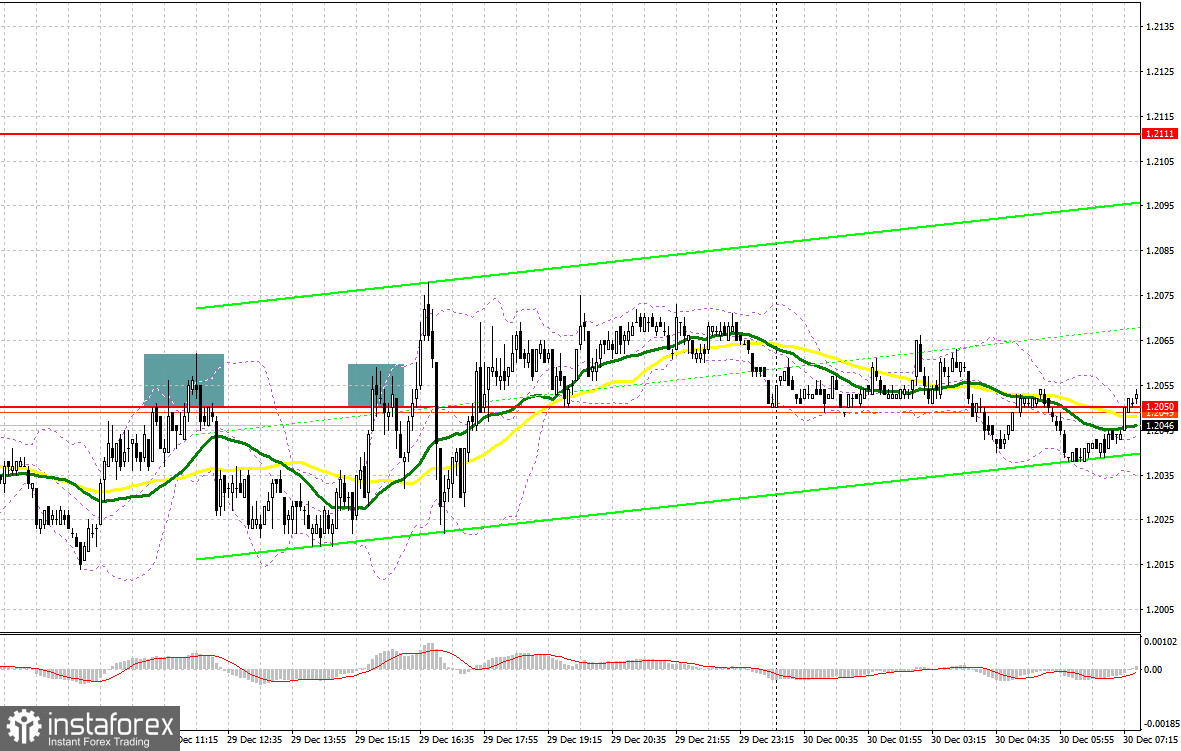
Yesterday, there were some interesting signals to enter the market. Let's take a look at the 5-minute chart and figure out what happened. Earlier, I asked you to pay attention to 1.2050 to decide when to enter the market. Growth and a false breakout at 1.2050 gave an excellent sell signal. As a result, the downward movement was about 25 pips. A similar signal appeared in the afternoon, but there was no sharp downward movement.
When to open long positions on GBP/USD:
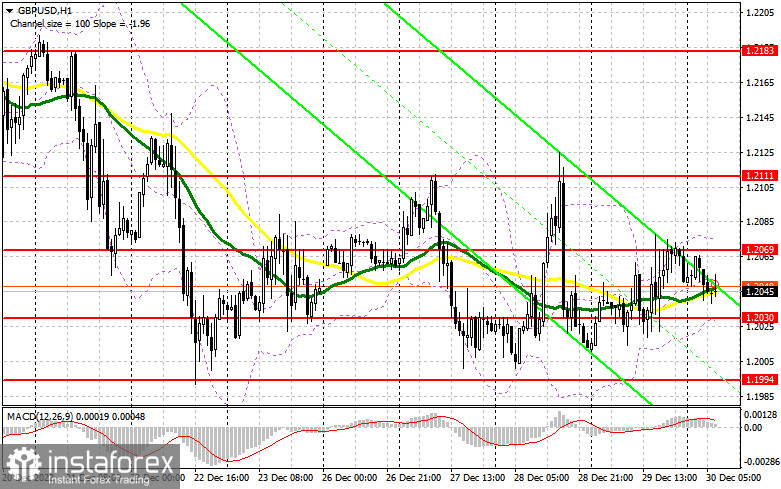
Among today's data, I only look forward to Nationwide's housing price index, in case it shows a decline then the British pound will go down as well. Therefore, the bulls might try to continue an upward correction once the pair settles above 1.2069. However in the current situation, I wouldn't expect the pound to rise at the end of the year. The best thing to see is a false breakout near support at 1.2030, which was formed yesterday. That will produce a buy signal so that the price can rise above 1.2069. A breakout and a consolidation in this range amid strong housing market results allows us to expect a sharper rally and an update of 1.2111, from which the pound was actively traded a couple of days ago. A breakout above 1.2111 with a similar test will open up growth prospects at 1.2183, where I recommend locking in profit. If the pair fails to reach 1.2030, the pressure on the pair will increase considerably and this will affect the bulls' stop orders, and the update of the December low at 1.1994. For this reason I wouldn't rush to buy: it would be wise to open longs on a decline and a false breakout around the low at 1.1994. It is also possible to buy the asset on the rebound from 1.1949, keeping in mind an upward intraday correction of 30-35 pips.
When to open short positions on GBP/USD:
The bears made it clear that the pound has nothing to do above 1.2070. Now the main thing to do is to protect this resistance. While trade is carried out below this range, bears have the chance to update the December lows, but not for their breakthrough. Of course in the current situation, while we don't know what will happen with the volatility and trading volume, only a false breakout around the new resistance at 1.2069 will be a good signal to sell, this will give hope for a bearish movement and a new fall to 1.2030, and then to the low of 1.1994. A breakout and upward test of this range will provide a sell signal with the prospect of a movement to 1.1949 and the possibility of returning to 1.1904, where I recommend locking in profit. If GBP rises and bears show no energy at 1.2070, nothing bad will happen, but the pressure on the pound will weaken. In this case, only a false breakout around 1.2111 will provide an entry point into short positions, with the goal of moving down. If bears are not active there either, you could sell GBP/USD right from the high and 1.2183, keeping in mind a downward intraday correction of 30-35 pips.
COT report:
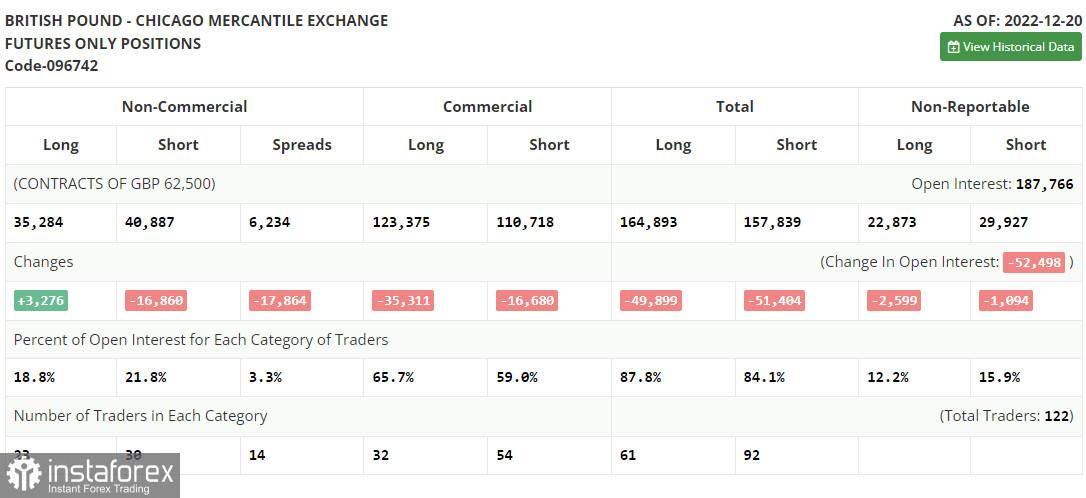
The COT report for December 20 logged a rise in long positions and a fall in short ones. After the key meetings of central banks, including the Bank of England, it became clear: central banks are going to continue to raise interest rates and tighten monetary policy, which by all rules, should lead to demand for national currencies, including the British pound. However, given that the UK's Q3 GDP data was revised downwards, and the onset of recession is not an expectation but a reality for next year, it is unlikely that traders will continue to buy the pound with the same fervor in January. According to the latest COT report, short non-commercial positions were down 16,860, to 40,887, while long non-commercials were up 3,276, to 35,284. Consequently, the non-commercial net position came down to -5,603 from -25,739 a week ago. The weekly closing price of GBP/USD was down to 1.2177 versus 1.2377.
Indicators' signals:
Trading is carried out near the 30 and 50 daily moving averages. It indicates that the pair is moving sideways.
Moving averages
Note: The period and prices of moving averages are considered by the author on the H1 (1-hour) chart and differ from the general definition of the classic daily moving averages on the daily D1 chart.
Bollinger Bands
If GBP/USD rises, the indicator's upper limit at 1.2070 will serve as resistance.
Description of indicators
- Moving average (moving average, determines the current trend by smoothing out volatility and noise). Period 50. It is marked yellow on the chart.
- Moving average (moving average, determines the current trend by smoothing out volatility and noise). Period 30. It is marked green on the chart.
- MACD indicator (Moving Average Convergence/Divergence - convergence/divergence of moving averages) Quick EMA period 12. Slow EMA period to 26. SMA period 9
- Bollinger Bands (Bollinger Bands). Period 20
- Non-commercial speculative traders, such as individual traders, hedge funds, and large institutions that use the futures market for speculative purposes and meet certain requirements.
- Long non-commercial positions represent the total long open position of non-commercial traders.
- Short non-commercial positions represent the total short open position of non-commercial traders.
- Total non-commercial net position is the difference between the short and long positions of non-commercial traders.


