


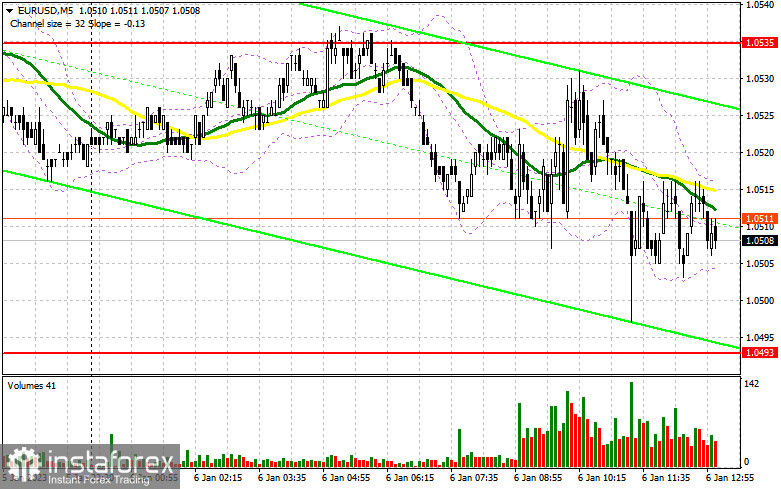
In my morning forecast, I highlighted the levels of 1.0535 and 1.0493 and advised traders to enter the market at those levels. Let's take a look at the 5-minute chart and see what happened. Despite the release of several eurozone statistics, we did not meet the targets, which prevented us from gaining market access. Volatility also fell ahead of the release of important statistics in the afternoon. The technical picture, like the strategy, remained virtually unchanged.
To open long positions on EURUSD, you will need the following:
We are anticipating an important labor market report: the unemployment rate for December of this year will recede into the background, while a more important indicator will be the change in the number of people employed in the non-agricultural sector. The increase in employment above economists' forecasts will cause the US dollar to strengthen further against the euro, as will the ISM's report on the index of business activity in the services sector. If the data disappoints, there is a chance for the pair to rebound at the end of the week, so it is also worth watching. As previously stated, the technical picture remained unchanged. It is best to buy the pair when it is falling around 1.0490. The formation of a false breakdown at this level will signal the bulls to enter the market, allowing them to reach the Asian high of 1.0530. After news of a sharp decline in new jobs in the US, a breakout and top-down test of this range form an additional entry point for building up long positions with a bounce to a maximum of 1.0566, where the moving averages are on the bears' side. A break of this level will also trigger stop orders, indicating the possibility of a breakout to 1.0596, a test that will rule out the possibility of a new bearish trend. Profits should be fixed there, in my opinion. If the EUR/USD falls and there are no buyers at 1.0490 in the afternoon, the pair's pressure will increase significantly. As a result, the focus will be on the next support level of 1.0451, where only a false breakdown will signal a buy signal against the trend. Long positions can be opened immediately for a rebound from the low of 1.0395, or even lower - around 1.0346 - with the goal of a 30-35 point upward correction within the day.
To open a short position on EURUSD, you will need the following:
Sellers maintain market control and are prepared to update the lows. However, as previously stated, everything will be determined by statistics. Of course, selling from 1.0530 would ensure that there are large players in the market betting on the pair falling further. In the case of EUR/USD growth against the backdrop of weak labor market data, an unsuccessful consolidation above 1.0530 will result in a sell signal and a new downward movement to the 1.0490 area. A breakdown and reverse test of this range will put more pressure on the euro, signaling another sell signal with an exit at 1.0451, where the bears are likely to retreat already. Consolidation below this range will result in a more significant downward movement to 1.0395, resulting in the formation of a new bear market at the start of the year. The most distant target is the 1.0346 area, where I recommend taking profits. If the EUR/USD rises during the American session and there are no bears at 1.0535, I recommend holding short positions until 1.0566, as a sharp upward jerk of the pair is not ruled out. There, I recommend that you sell only after an unsuccessful consolidation. It is possible to sell EUR/USD immediately on a rebound from the high of 1.0596, with the goal of a 30-35 point decline.
Signals from indicators:
Moving Averages
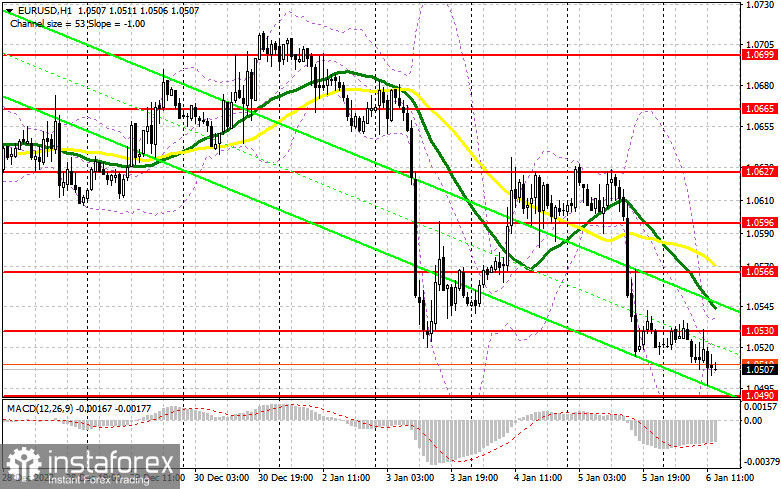
Trading is taking place slightly above the 30 and 50-day moving averages, indicating the market's lateral nature.
Note: The author considers the period and prices of moving averages on the hourly chart H1, which differs from the general definition of classic daily moving averages on the daily chart D1.
Bands of Bollinger
In the event of the growth, the indicator's upper limit around 1.0630 will act as resistance.
Description of indicators
- Moving average (moving average determines the current trend by smoothing out volatility and noise). Period 50. The graph is marked in yellow.
- Moving average (moving average determines the current trend by smoothing out volatility and noise). Period 30. The graph is marked in green.
- MACD indicator (Moving Average Convergence / Divergence - moving average convergence/divergence) Fast EMA period 12. Slow EMA period 26. SMA period 9
- Bollinger Bands (Bollinger Bands). Period 20
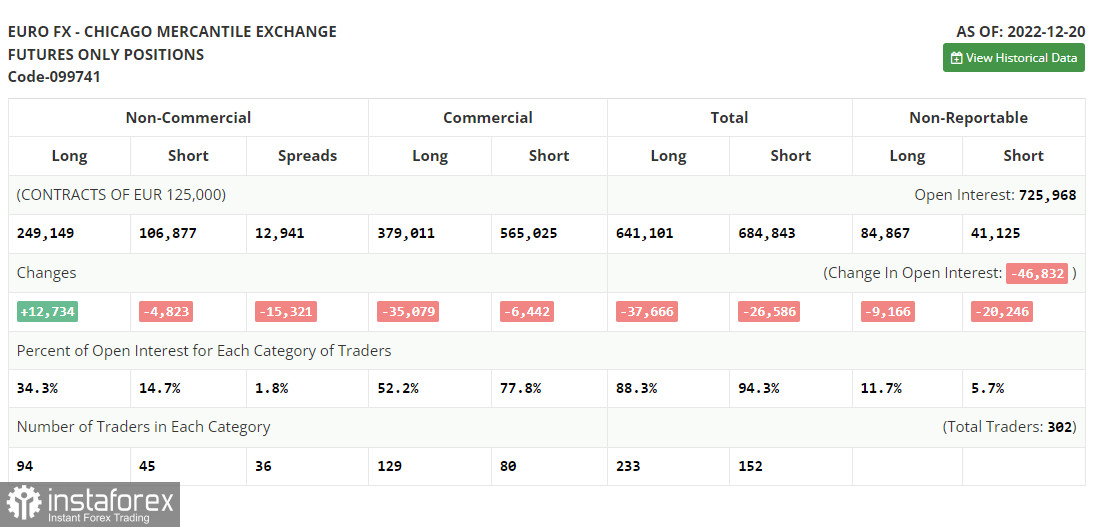
- Non-profit speculative traders, such as individual traders, hedge funds, and large institutions, use the futures market for speculative purposes and to meet certain requirements.
- Long non-commercial positions represent the total long open position of non-commercial traders.
- Short non-commercial positions represent the total short open position of non-commercial traders.
- Total non-commercial net position is the difference between the short and long positions of non-commercial traders.


