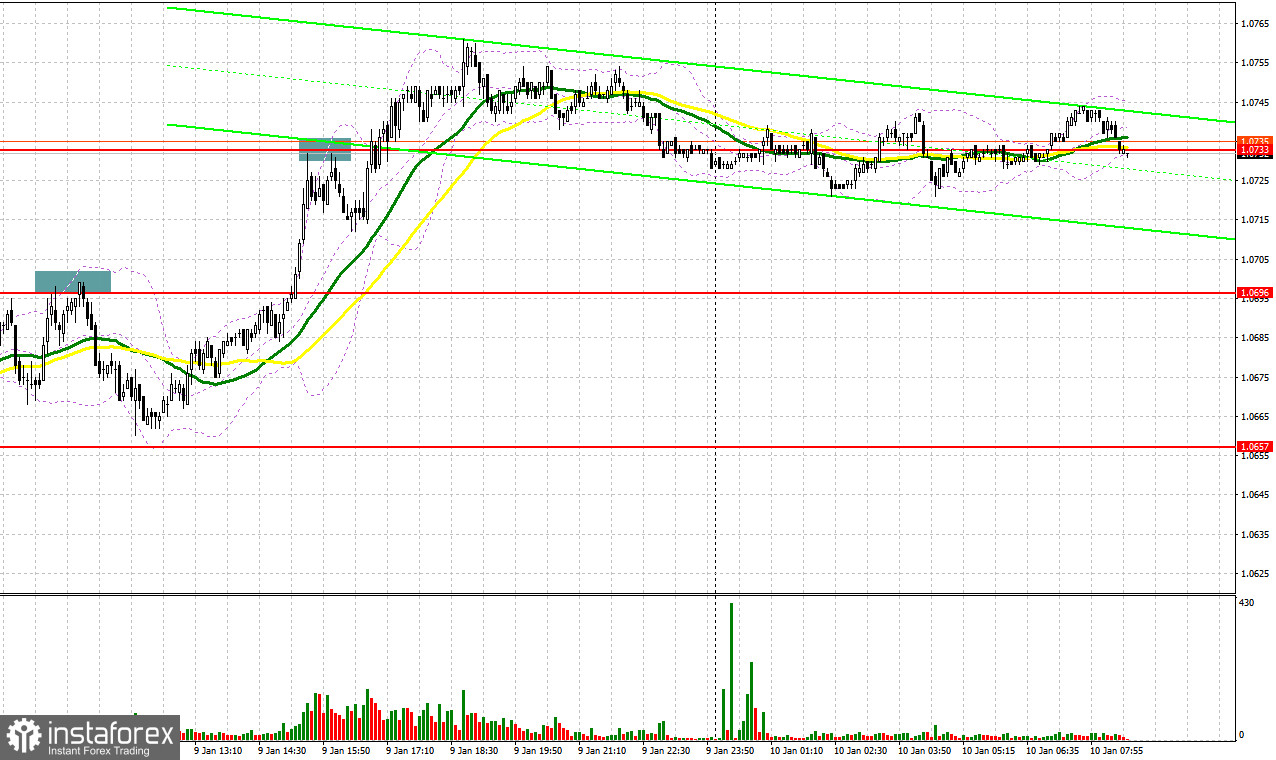
There were several entry signals yesterday. Let us have a look at the 5-minute chart and figure out what happened. In my morning forecast, I highlighted the level of 1.0696 and recommended making market entry decisions with this level in mind. The bullish momentum, which has been going on since last Friday, created a sell signal yesterday after performing a false breakout above 1.0696. EUR/USD then moved down by 40 pips but failed to reach 1.0657. In the second half of the day, the euro advanced to 1.0733 and performed a false breakout of this area. However, no major downward movement followed.

When to open long positions in EUR/USD:
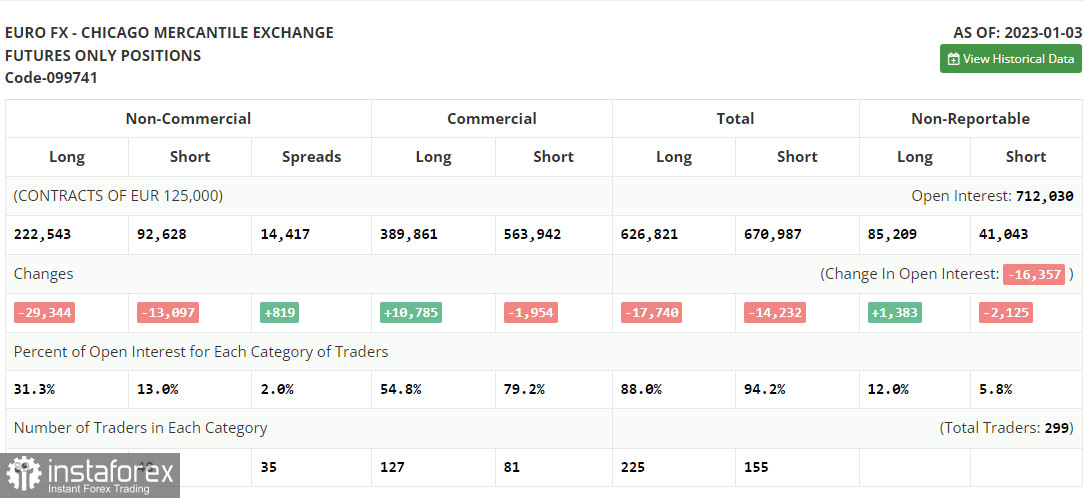
First, let us have a look at the futures market and the latest Commitments of Traders report. The Commitment of Traders (COT) report for January 3 showed that both long and short positions declined dramatically. Traders preferred to take profits at the beginning of the year amid uncertainty over the future policy of the Federal Reserve and the European Central Bank. Now, with inflation starting to slow down, it is clearly the right time to ease aggressive policy measures, but no one is going to do that at this point. Demand for risky assets is limited as market participants expect the global economy to enter a recession this yera. The US inflation data is also expected to be released soon, which will determine the Federal Reserve's future policy. Fed chairman Jerome Powell is likely to give a speech on this issue this week. The COT report indicates that long non-commercial positions fell by 29,344 to 222,543, while short non-commercial positions dropped by 13,097 to 92,628. At the end of the week, non-commercial net positioning declined sharply to 129,915 versus 142,279. Despite these developments, everything indicates that investors continue to buy the euro in anticipation that central banks will ease hawkish policies this year. However, a new fundamental trigger is necessary to keep the euro on a good footing. The weekly closing price decreased to 1.0617 against 1.0690 the week before.

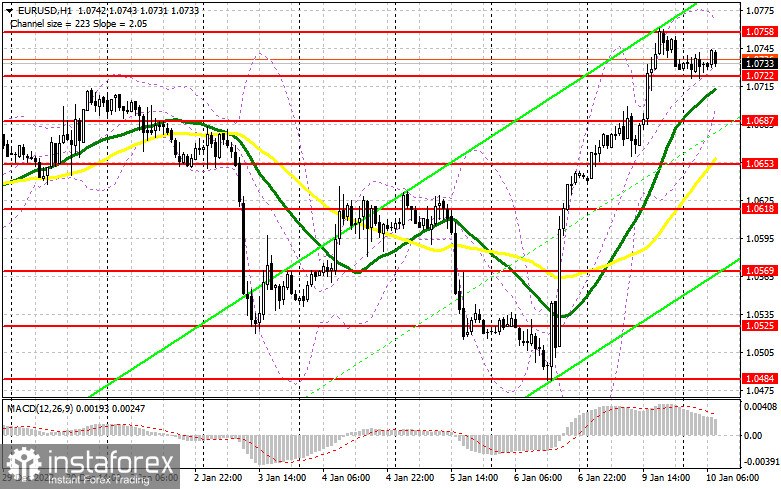
Last week's bullish momentum is now running out of steam. There are no important data releases today, and traders will be likely focused on statements by representatives of major central banks. The vice-president of the German Bundesbank Claudia Buch is expected to give a speech today, followed by ECB policymaker Isabel Schnabel. If they do not hint at any dovish pivots, the euro will likely drop to the support level of 1.0722, which was formed and tested repeatedly during the Asian session. A false breakout of this level will be a buy signal, with the closest resistance at the weekly high near 1.0758 being the target. If EUR/USD breaks through this level and performs a downward retest, it may then climb to 1.0791, opening the way towards 1.0820. The most distant target is 1.0853, the new monthly high, where I recommend taking profits. However, the pair is unlikely to reach it at this point. If EUR/USD declines and bulls are inactive at 1.0722, the pair is likely to come under increased pressure. However, a buy signal will only be created if the pair performs a false breakout of the next support level of 1.0687, where the moving averages lie. You can buy EUR/USD immediately if it bounces off the low at 1.0653 or 1.0618 further below, targeting an upward intraday correction of 30-35 pips.
When to open short positions in EUR/USD:
Although bullish traders have pushed the pair towards another high, its further upside potential is limited, as many technical indicators are in overbought territory. Bears might take advantage of this amid the lack of key data releases. If EUR/USD performs a false breakout of 1.0758, it may push the pair towards the support at 1.0722. Then, if the pair breaks through this level and performs an upward retest, it will trigger stop loss orders of bulls and create an additional sell signal. This will send the pair downwards to 1.0687. Further movement below this level can be expected if Jerome Powell's statements later today turn out to be hawkish - EUR/USD may then test 1.0653, where I recommend taking profits. If EUR/USD moves up during the European session and bearish traders are inactive at 1.0758, bulls will maintain control over the market. In this case, short positions should be opened only if the pair performs a false breakout of 1.0791. You can sell EUR/USD immediately if it bounces off the high at 1.0820 or 1.0853 above it, targeting a downward intraday correction of 30-35 pips.

Indicators' signals:
Moving averages:
Trading is carried out just above the 30 and 50-day moving averages, indicating that bullish traders have the advantage in the market.
Note: The period and prices of moving averages are considered by the author on the H1 (1-hour) chart and differ from the general definition of the classic daily moving averages on the daily D1 chart.
Bollinger Bands
If the pair decreases, the bottom boundary of the indicator near 1.0700 will provide support. If EUR/USD rises, the upper boundary of the indicator at 1.0760 will serve as resistance.
Description of indicators
• Moving average (moving average, determines the current trend by smoothing out volatility and noise). Period 50. It is marked yellow on the chart.
• Moving average (moving average, determines the current trend by smoothing out volatility and noise). Period 30. It is marked green on the chart.
• MACD indicator (Moving Average Convergence/Divergence - convergence/divergence of moving averages) Quick EMA period 12. Slow EMA period to 26. SMA period 9
• Bollinger Bands (Bollinger Bands). Period 20
• Non-commercial speculative traders, such as individual traders, hedge funds, and large institutions that use the futures market for speculative purposes and meet certain requirements.
• Long non-commercial positions represent the total long open position of non-commercial traders.
• Short non-commercial positions represent the total short open position of non-commercial traders.
• Total non-commercial net position is the difference between the short and long positions of non-commercial traders.


