


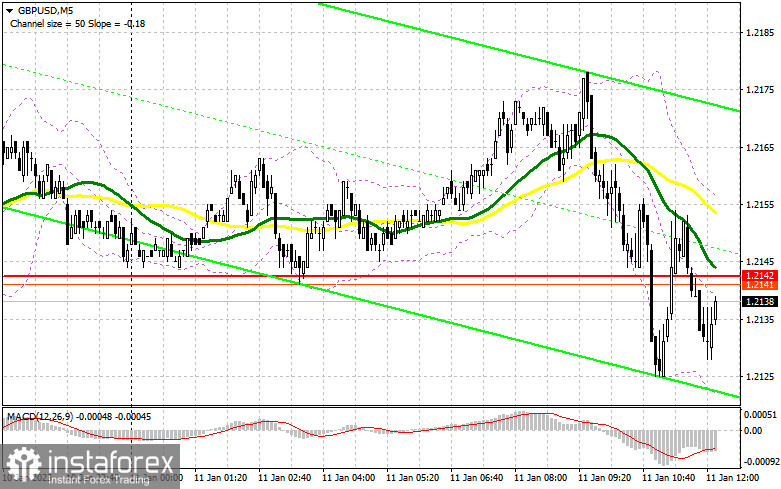
I focused on the level of 1.2142 in my morning forecast and suggested making decisions about joining the market there. Let's analyze the 5-minute chart to see what transpired. The move to this range didn't involve a false breakdown or a bottom-up reverse test where the bears had to hold their ground. These factors made it impossible to receive signals to join the market during the morning hours. The situation has drastically shifted for the American session.
You require the following to open long positions on the GBP/USD:
The lack of news will undoubtedly keep the pressure on the pair because fewer people want to buy at the moment before tomorrow's inflation in the US. Bulls should demonstrate their strength around the nearest support level of 1.2113, which is the low point from yesterday and the point at which the pound was vigorously redeemed following the collapse. I'll concentrate on this level since, similar to yesterday, the development of a false breakdown there will signal a buy signal for the continuation of the upward trend, allowing us to go back to 1.2175, a new resistance level created by today's results. Sellers' stop orders will be hit by a breakout and a top-down test of 1.2175, which is just below where the moving averages pass. This will trigger a buy signal and a more pronounced upward move with the update of 1.2234. With a comparable test and an exit over 1.2234, growth chances at 1.2301 will become available, and that's where I'll take a profit. Even though the area of 1.2350 will be further away, we won't be able to quickly attain it without significant political or structural reforms. If the bulls are unable to handle the tasks at hand and miss 1.2113, which I also firmly doubt, I anticipate the emergence of a stronger downward correction. Due to this, I suggest that you hold off on making any purchases right away. Instead, open long positions on a downturn and a false breakdown close to the subsequent low of 1.2061. To recover from 1.2008 and correct 30-35 points within a day, I will buy GBP/USD right away.
You require the following to open short positions on the GBP/USD:
The bears emerged in the morning and will undoubtedly apply pressure to the pair until it reaches the lower limit of the new side channel, which is 1.2113. Of course, a false breakdown at the upper limit of 1.2175 would provide an ideal signal for the pound to break through with a return to support around 1.2113, making that scenario a more optimal one for selling in the current circumstances when the pair is locked in. The pressure on the pound will only rise with a breakout and a reversal test from the bottom up of this range, which will also provide an entry point to sell with a move to 1.2061 and the potential for updating 1.2008, where I advise fixing profits. The region around 1.1940 will be the farthest objective. Buyers of the pound will feel the strength with the possibility of GBP/USD growth and the lack of bears around 1.2175 in the afternoon, which may even result in an update of the monthly maximum. In this instance, the only entry point into short positions with the intention of a new downward movement is a false breakdown in the vicinity of the next resistance level of 1.2234. If there is no activity there, I will sell GBP/USD right away at the highest price of 1.2301, but only if I believe the pair will fall back by 30-35 points over the day.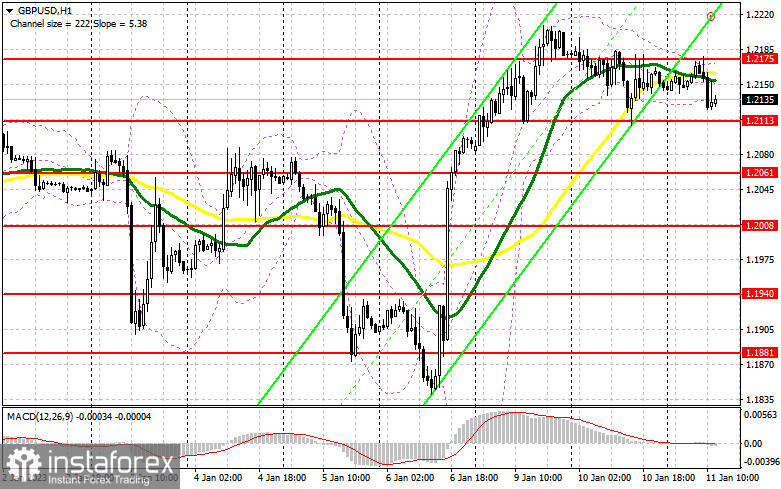
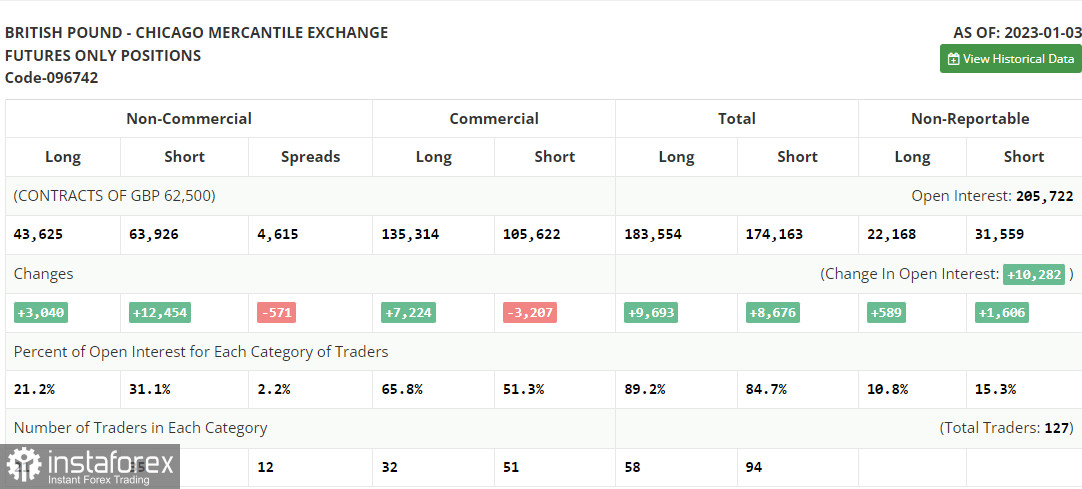
Long and short positions increased in the COT report (Commitment of Traders) for January 3. The latter turned out to be nearly four times higher, which amply demonstrates the lack of confidence among buyers in the pound's promising future at the start of this year. This is bad news for the British pound since regulators won't change their approach just yet and will keep raising interest rates. The Bank of England will decrease interest rates and the economy has already entered a recession, which is the key factor limiting the rise of the pound. You can easily ignore the growth of the pound in the first quarter of this year if the figures on inflation in the United States, which are anticipated in the near future, even signal its growth. According to the most recent COT report, short non-commercial positions increased by 12,454 to 63,926, while long non-commercial positions increased by 3,040 to 43,625. These changes caused the non-commercial net position's negative value to decrease to -20 301 from -5,603 the previous week. The delta's reversal to the downside demonstrates once more that no one is eager to purchase the pound at its current highs. The closing price for the week dropped from 1.2177 to 1.2004.
Signals from indicators
Moving Averages
Trading occurs around the 30 and 50-day moving averages, which highlights additional challenges with direction selection.
Notably, the author considers the time and prices of moving averages on the hourly chart H1 and departs from the standard definition of the traditional daily moving averages on the daily chart D1.
Bands by Bollinger
The indicator's upper limit, which is located at 1.2175, will serve as resistance in the event of growth.
Description of indicators
- Moving average (moving average determines the current trend by smoothing out volatility and noise). Period 50. The graph is marked in yellow.
- Moving average (moving average determines the current trend by smoothing out volatility and noise). Period 30. The graph is marked in green.
- MACD indicator (Moving Average Convergence / Divergence - moving average convergence/divergence) Fast EMA period 12. Slow EMA period 26. SMA period 9
- Bollinger Bands (Bollinger Bands). Period 20
- Non-profit speculative traders, such as individual traders, hedge funds, and large institutions use the futures market for speculative purposes and to meet certain requirements.
- Long non-commercial positions represent the total long open position of non-commercial traders.
- Short non-commercial positions represent the total short open position of non-commercial traders.
- Total non-commercial net position is the difference between the short and long positions of non-commercial traders.


