Details of the economic calendar on January 11
The macroeconomic calendar was conditionally empty. Important statistics for the UK, Europe and the United States were not released.
For this reason, investors and traders monitored the incoming information flow.

Analysis of trading charts from January 11
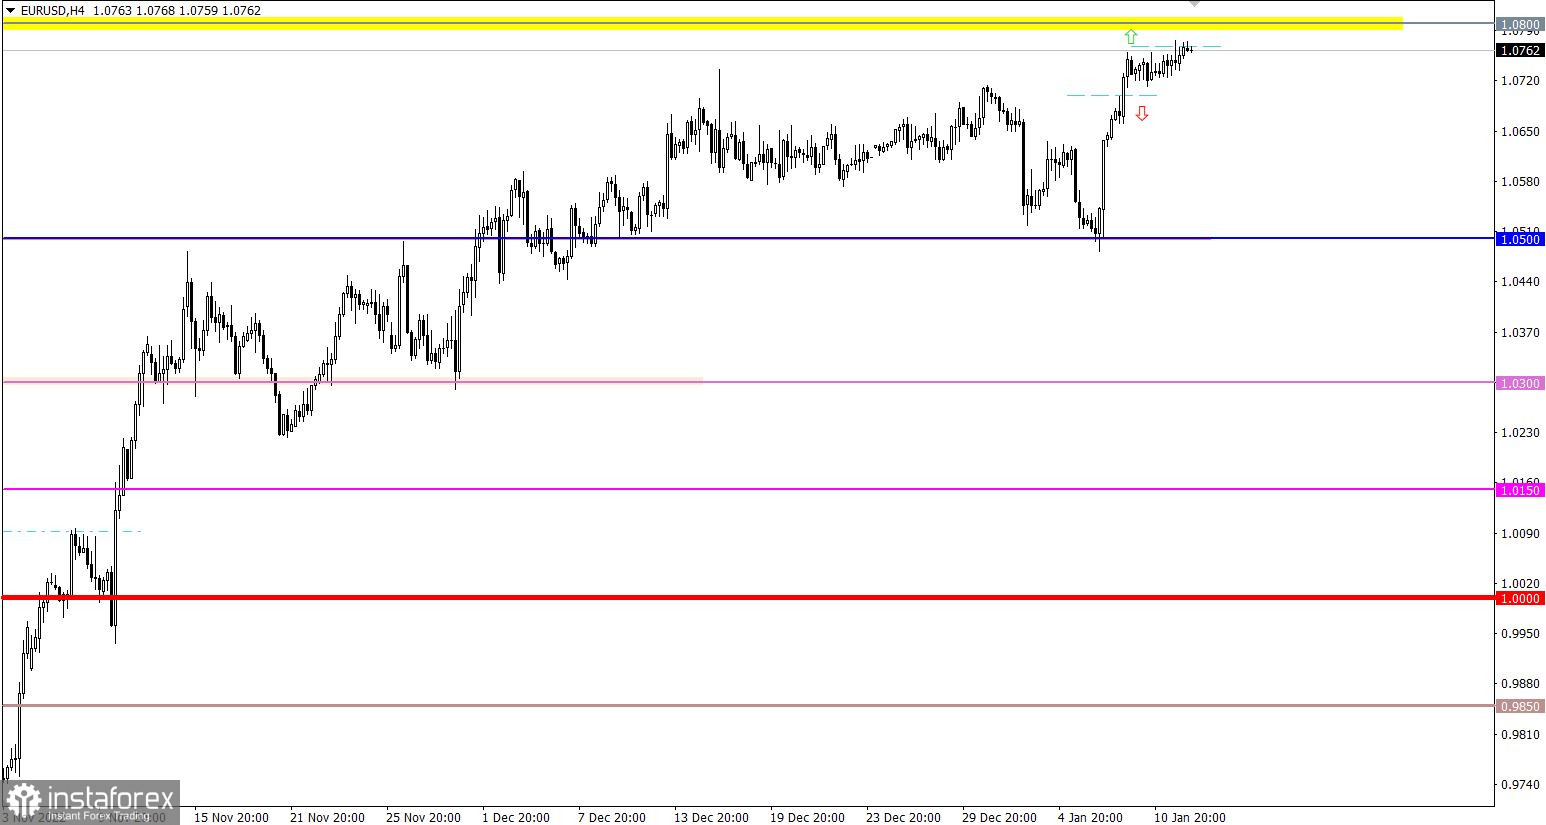
The EURUSD currency pair, after a short stagnation in the range of 1.0710/1.0760, overcame its upper limit. As a result, the upward cycle was prolonged, where the recent stop became the stage of the regrouping of trading forces.
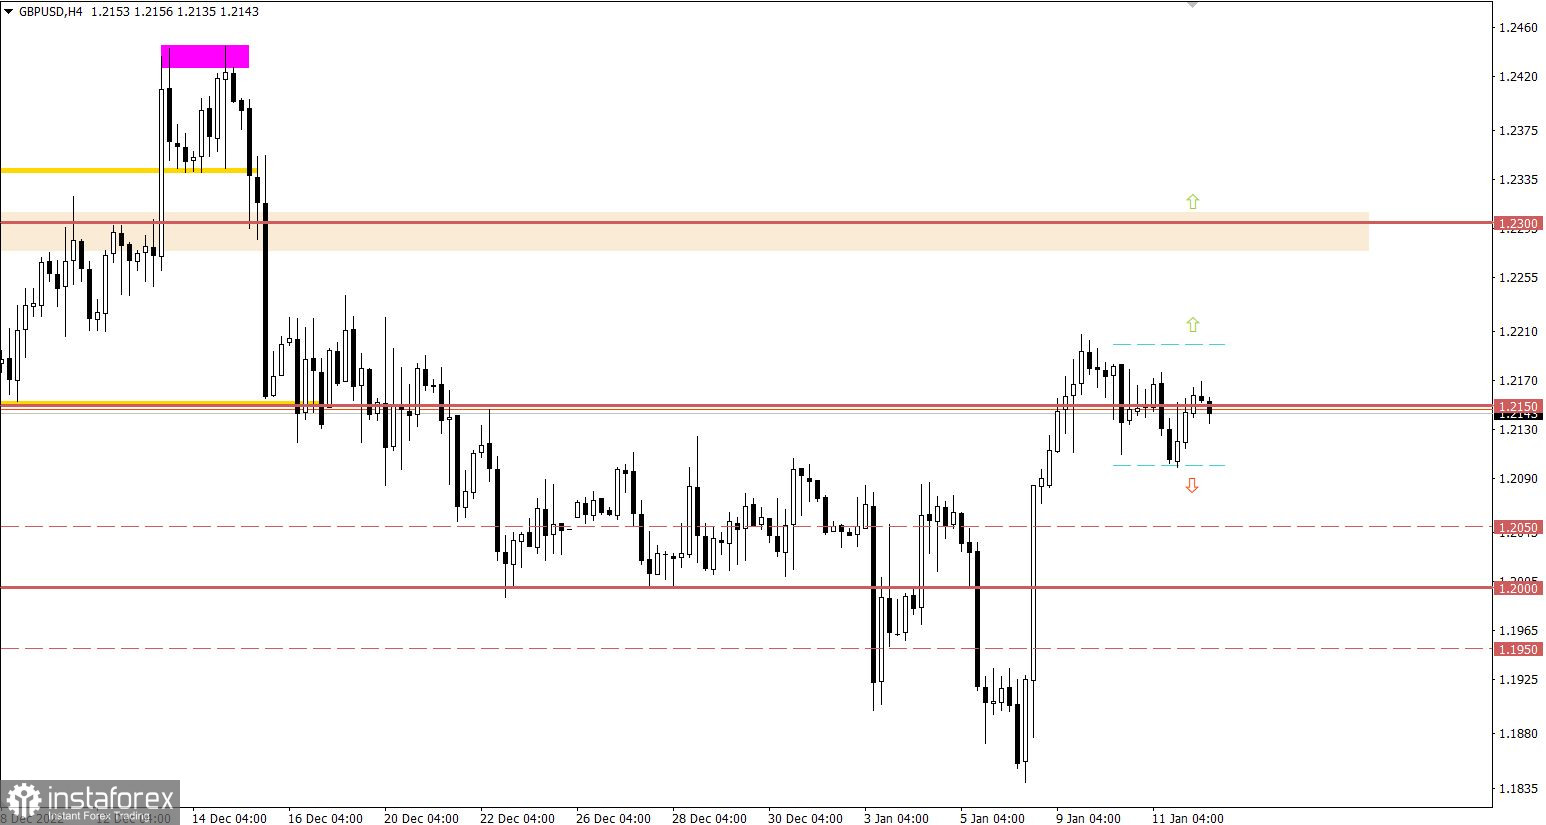
The GBPUSD currency pair has been in a pullback stage since the beginning of the trading week, while the upward trend remains among traders. This is indicated by the constant return of the price to the 1.2150 mark.
Economic calendar for January 12
Today all traders' attention will be focused on the inflation data in the United States, as the fate of the interest rate depends on the dynamics of this indicator. Based on the economic outlook, consumer price index will continue to decline from 7.1% to 6.5%, which is a positive signal for the U.S. stock market, while the U.S. dollar may go on a further sell-off.
The weekly jobless claims will also be released, where the total volume is expected to rise. This is a negative factor for the U.S. labor market.
Statistics details:
The volume of continuing claims for benefits may rise from 1.694 million to 1.705 million.
The volume of initial claims for benefits may rise from 204,000 to 215,000.
Time targeting:
U.S. Inflation – 13:30 UTC
U.S. Jobless Claims – 13:30 UTC
EUR/USD trading plan for January 12
A stable holding of the price above the value of 1.0760 will eventually lead to a breakdown of the next resistance level at 1.0800. In turn, this step allows for the subsequent formation of a medium-term upward trend for the euro.
The downside scenario will be considered by traders in case of a reversal, with the price holding below 1.0700. In this case, a correction is allowed.

GBP/USD trading plan for January 12
Although the pullback is still taking place in the market, a price return above 1.2200 will complete it. In this scenario, the prolongation of the upward cycle with the strengthening of long positions is possible.
An alternative scenario will be considered by traders if the price stays below 1.2100. In this case, the pullback will continue its formation towards the 1.2000 psychological level.

What's on the charts
The candlestick chart type is white and black graphic rectangles with lines above and below. With a detailed analysis of each individual candle, you can see its characteristics relative to a particular time frame: opening price, closing price, intraday high and low.
Horizontal levels are price coordinates, relative to which a price may stop or reverse its trajectory. In the market, these levels are called support and resistance.
Circles and rectangles are highlighted examples where the price reversed in history. This color highlighting indicates horizontal lines that may put pressure on the asset's price in the future.
The up/down arrows are landmarks of the possible price direction in the future.


