


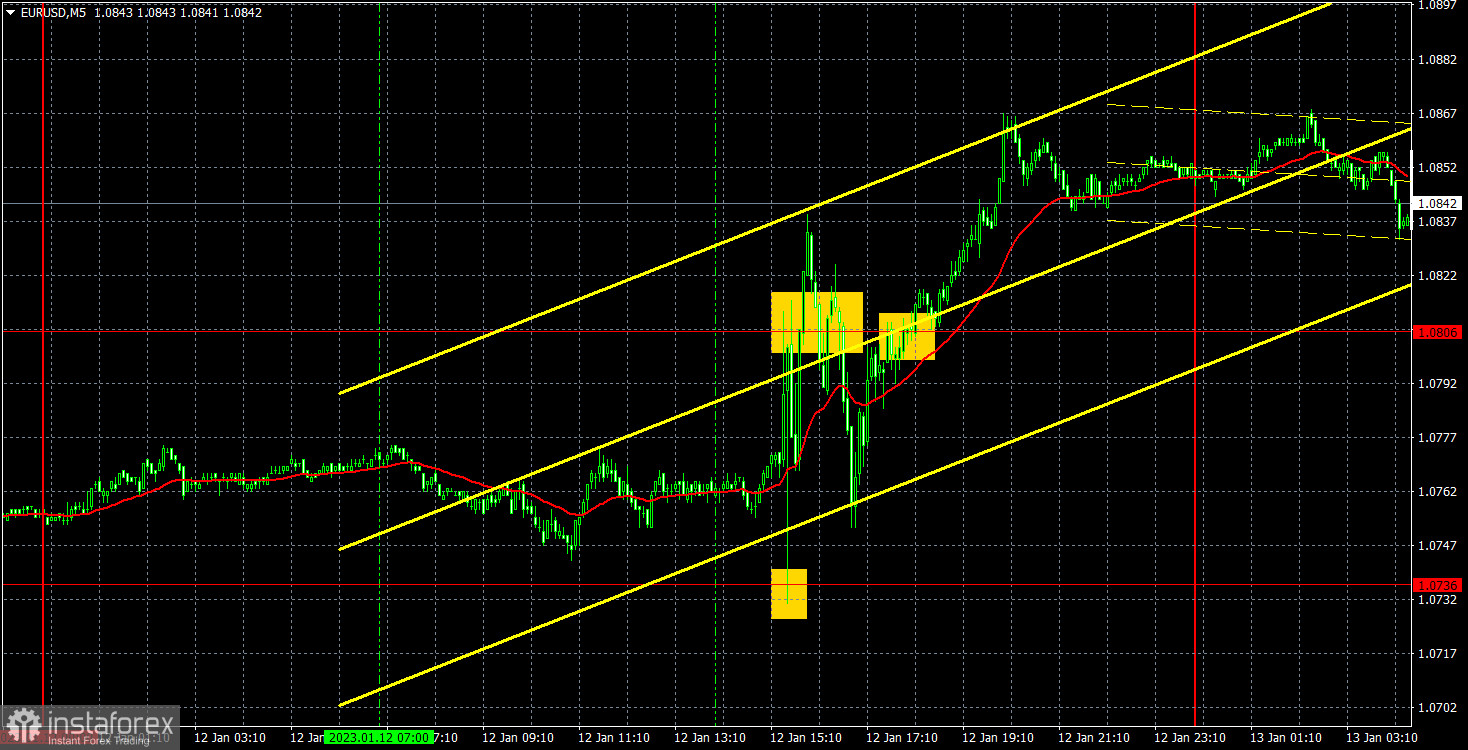
M5 chart of EUR/USD
On Thursday, EUR/USD continued to move mainly sideways until the US inflation report was released. We learned that the inflation rate fell again in December, to 6.5% on an annual basis. Just as I mentioned: the stronger and faster inflation falls, the more likely it is that the dollar will fall as well. The logic is simple: the Federal Reserve has less and less reason to continue raising rates at all. Thus, yesterday was quite logical in terms of the pair's movements. But it does not mean that the euro was growing logically and reasonably a few weeks before that. Remember that during the last several months we did not even witness a proper correction. It cannot rise for months just because of one factor, right? But on the other hand, expecting the euro to fall is a fundamental hypothesis. If it is not confirmed by concrete technical signals, you should not work it out.
All of Thursday's trading signals were formed after the release of the inflation data. That is the time when the price began to "fly" in all directions. In fact, the only strong and clear signal was the rebound from 1.0736, but it was very difficult to enter the market. The last buy signal around 1.0806 was produced when the market calmed down more or less, but at the same time, it was too late. The best option was not to enter the market yesterday.
COT report
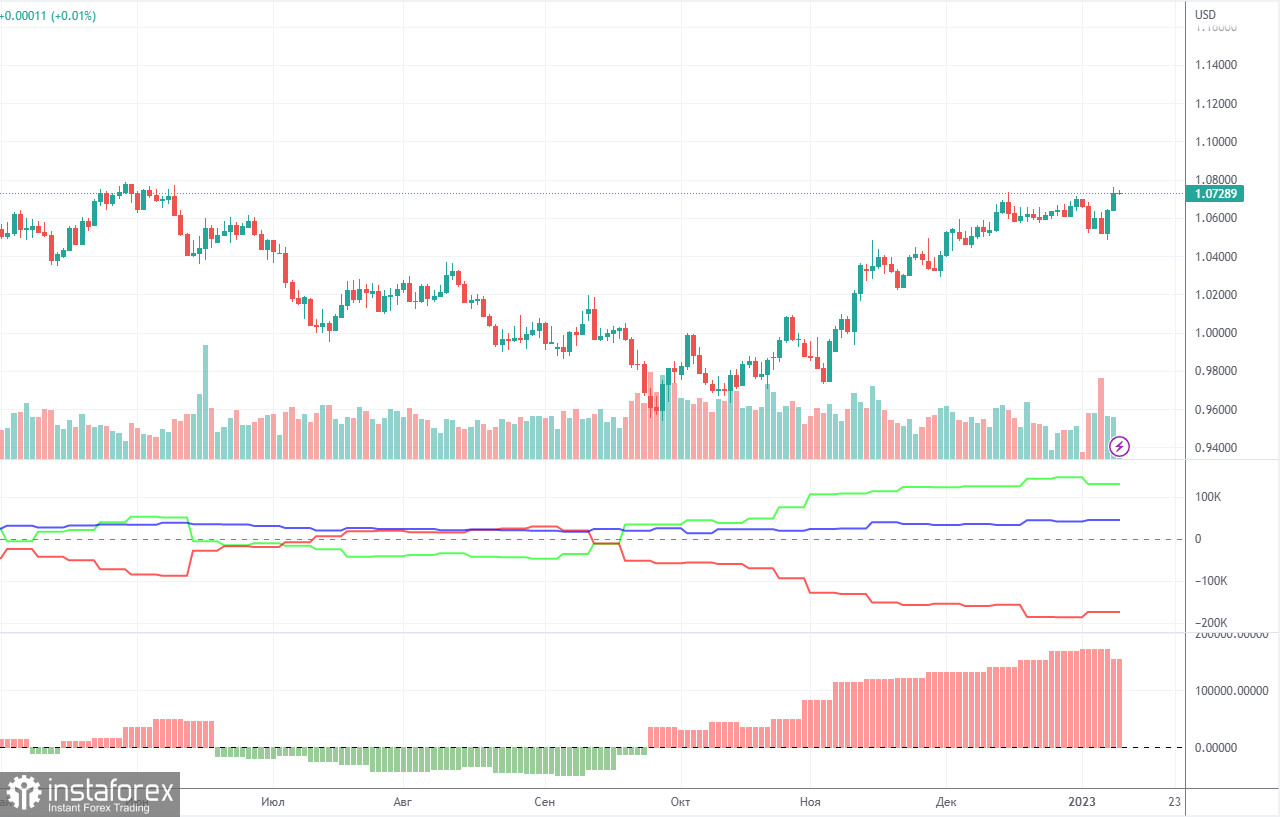
The COT reports for the euro in the last few months have been fully consistent with what is happening in the market. You can clearly see on the chart that the net position of big players (the second indicator) has been growing since early September. Around the same time, the euro started to grow. At this time, the net position of the non-commercial traders has been bullish and strengthens almost every week, but it is a rather high value that allows us to assume that the upward movement will end soon. Notably, the green and red lines of the first indicator have moved far apart from each other, which often means the end of the trend. During the given period, the number of long positions held by non-commercial traders decreased by 29,300, whereas the number of short positions fell by 13,100. Thus, the net positions decreased by 16,200. The number of long positions is 130,000 higher than the number of short positions opened by non-commercial traders. So the question now is how long will the big players increase their longs? Moreover, from a technical perspective, a bearish correction should have started a long time ago. In my opinion, this process can not continue for another 2 or 3 months. Even the net position indicator shows that we need to "unload" a bit, that is, to correct. The overall number of short orders exceeds the number of long orders by 44,000 (671,000 vs. 627,000).
H1 chart of EUR/USD
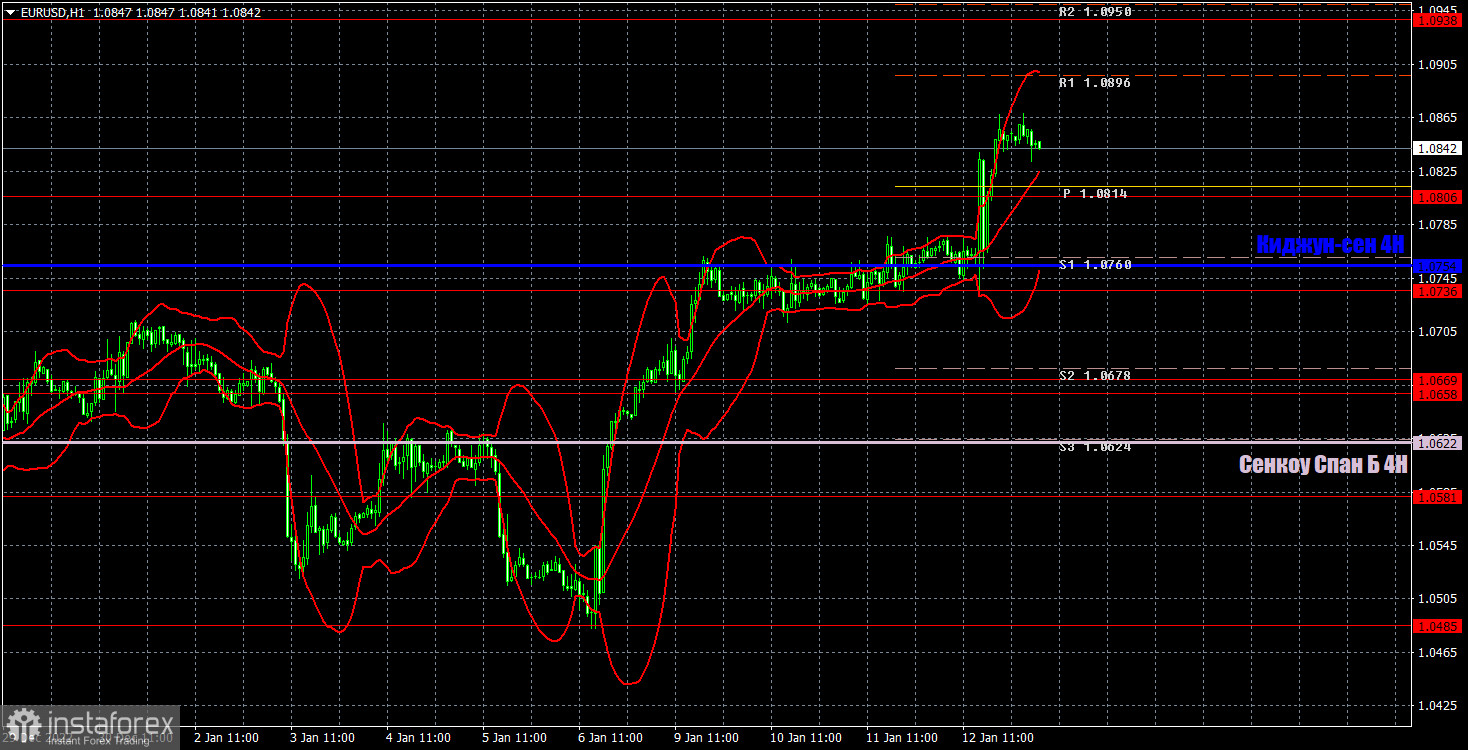
On the one-hour chart, EUR/USD continues the upward movement, which started last Friday. The movement is a consequence of the US data, which did not work against the dollar in all cases. But the market interpreted all the reports in favor of the euro, so we see a continuous upward movement. On Friday, the pair may trade at the following levels: 1.0485, 1.0581, 1.0658-1.0669, 1.0736, 1.0806, 1.0938, 1.1036, as well as the Senkou Spahn B (1.0597) and Kijun Sen (1.0630). Lines of the Ichimoku indicator may move during the day, which should be taken into account when determining trading signals. There are also support and resistance levels, but signals are not formed near these levels. Bounces and breakouts of the extreme levels and lines could act as signals. Don't forget about stop-loss orders, if the price covers 15 pips in the right direction. This will prevent you from losses in case of a false signal. On January 13, only the Consumer Sentiment Index will be released in the US and Industrial Production in the EU. Not the most important reports at this time.
What we see on the trading charts:
Price levels of support and resistance are thick red lines, near which the movement may end. They do not provide trading signals.
The Kijun-sen and Senkou Span B lines are the lines of the Ichimoku indicator, moved to the one-hour chart from the 4-hour one. They are strong lines.
Extreme levels are thin red lines from which the price bounced earlier. They provide trading signals.
Yellow lines are trend lines, trend channels, and any other technical patterns.
Indicator 1 on the COT charts reflects the net position size of each category of traders.
Indicator 2 on the COT charts reflects the net position size for the non-commercial group.


