


EUR/USD
Higher time frames
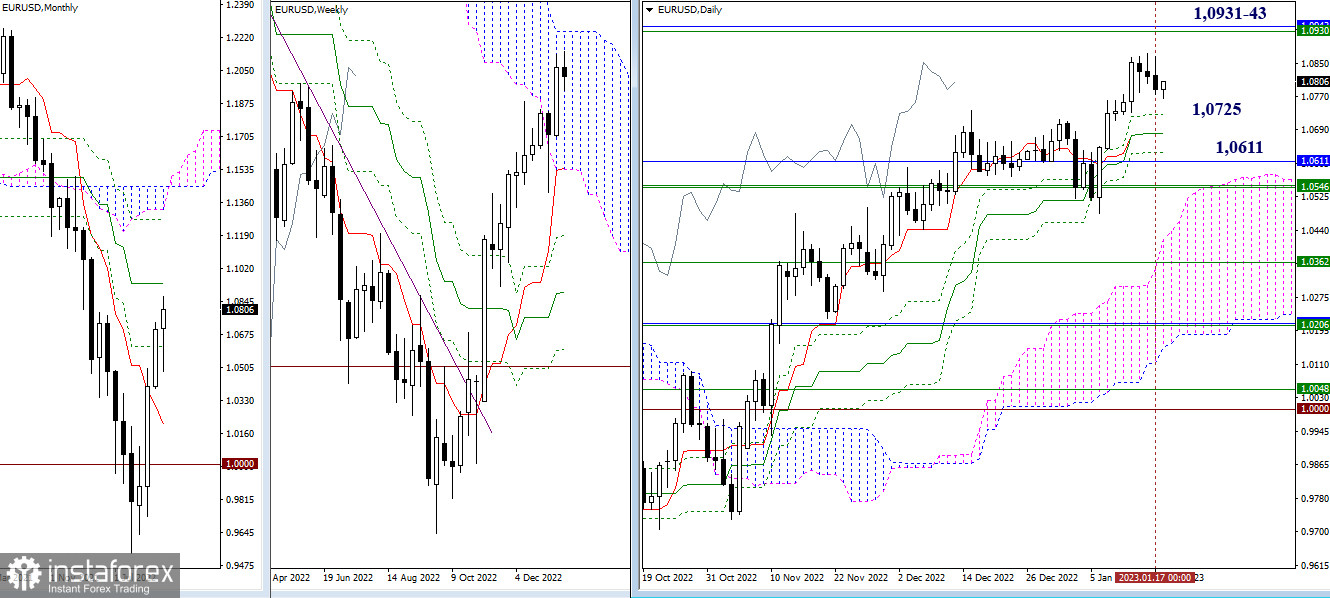
Bears are trying to develop a deeper correction on this time frame but they haven't succeeded yet. If the pair extends its downward movement, it will face support at the daily Ichimoku Cross found at 1.0725 – 1.0679 – 1.0633. Another support area is located a bit lower at the crossing of the monthly and weekly levels of 1.0611 – 1.0546. If bulls manage to regain control, their main upward target will be the resistance area of 1.0931-43 (upper boundary of the weekly Ichimoku Cloud + monthly medium-term trend).
H4 – H1
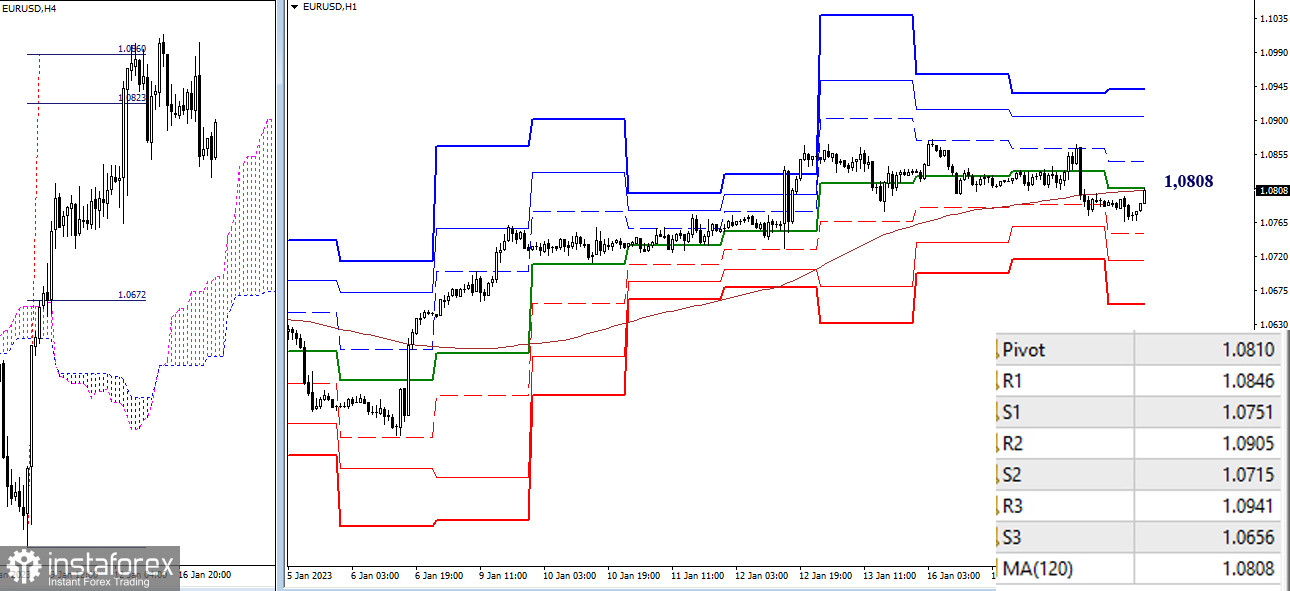
On lower time frames, the pair dropped below the key levels and is now retesting them. The key levels today are found at 1.0810-08 (central pivot level + weekly long-term trend). A rebound from this zone and continuation of the downtrend will send the price lower to intraday support found at standard pivot levels of 1.0751 – 1.0715 – 1.0656. Consolidation above this zone and the reversal of the moving average will help the bulls take over the market on lower time frames. If so, the next upward targets are seen at the resistance formed by standard pivot levels of 1.0846 – 1.0905 – 1.0941.
***
GBP/USD
Higher time frames
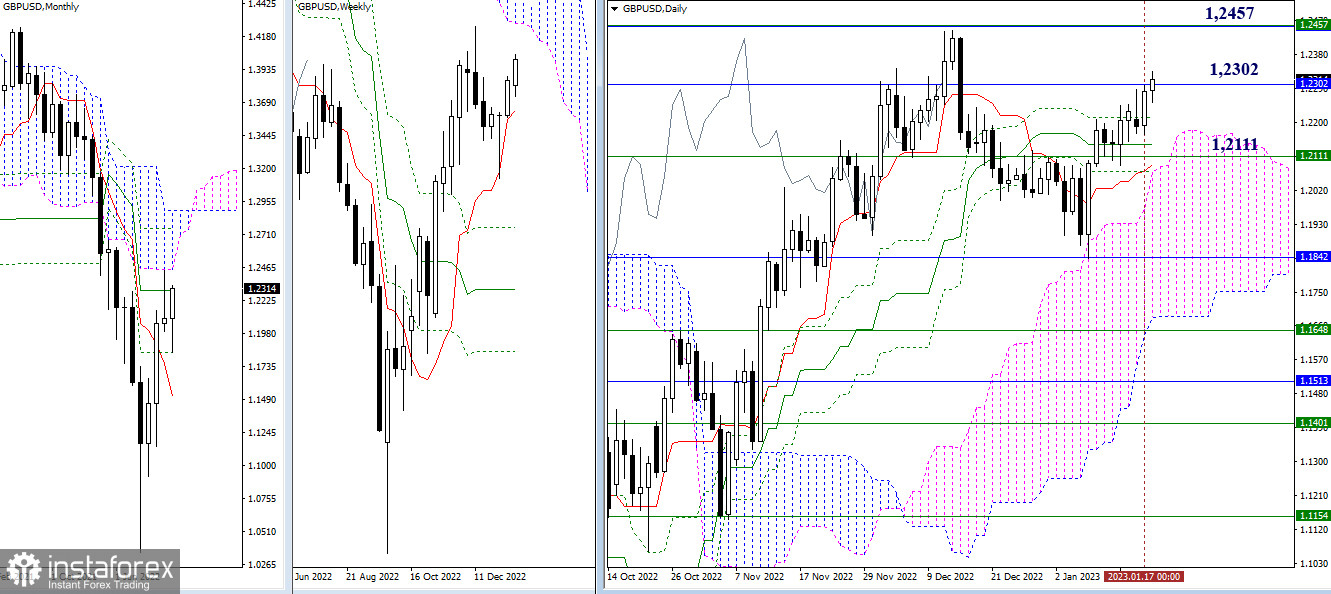
The buyers are now fighting to bring the price to the monthly level of 1.2302. Their next target will be the area of 1.2457 (lower boundary of weekly and monthly clouds). The levels of the daily Ichimoku Cross are forming an extended support zone (1.2214 – 1.2142 – 1.2064) which is also supplemented by the weekly short-term trend (1.2111) and upper boundary of the daily Ichimoku Cloud.
H4 – H1
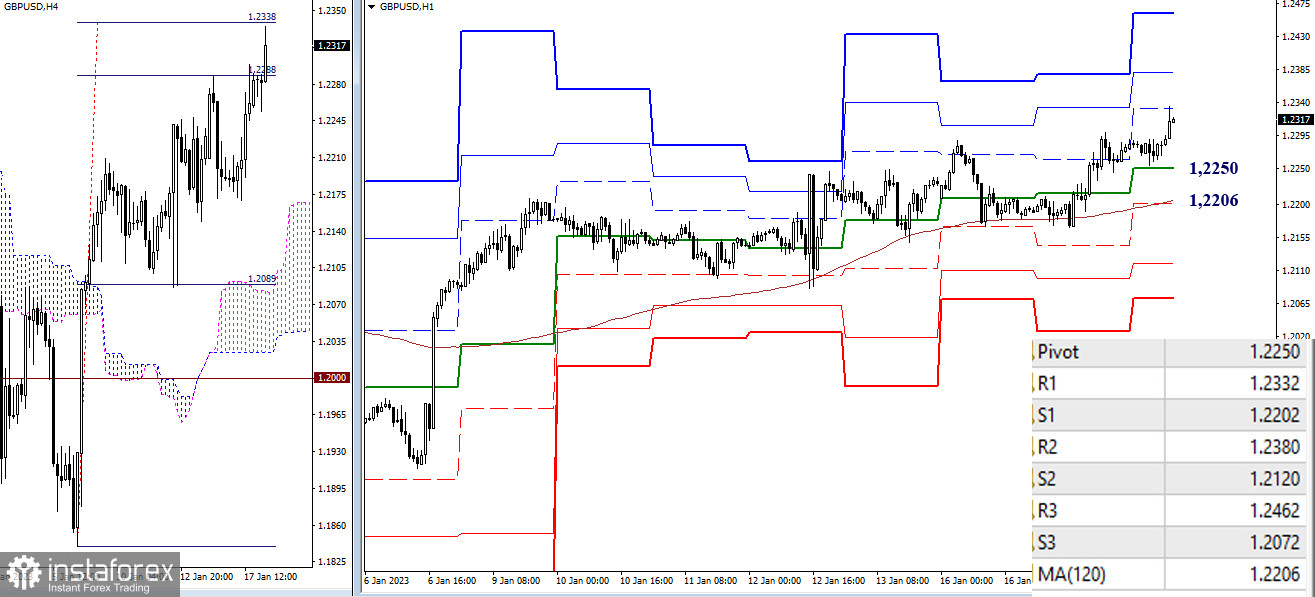
Bulls are leading on lower time frames. They are now testing the first resistance formed by a standard pivot level of 1.2332. The uptrend will continue intraday if the price successfully breaks through the Ichimoku Cloud on H4 and through the final resistance area formed by standard pivot levels of 1.2380 – 1.2462.
***
Technical analysis is based on:
Higher time frames – Ichimoku Kinko Hyo (9.26.52) + Fibo Kijun levels
H1 – Pivot Levels (standard) + 120-day Moving Average (weekly long-term trend)


