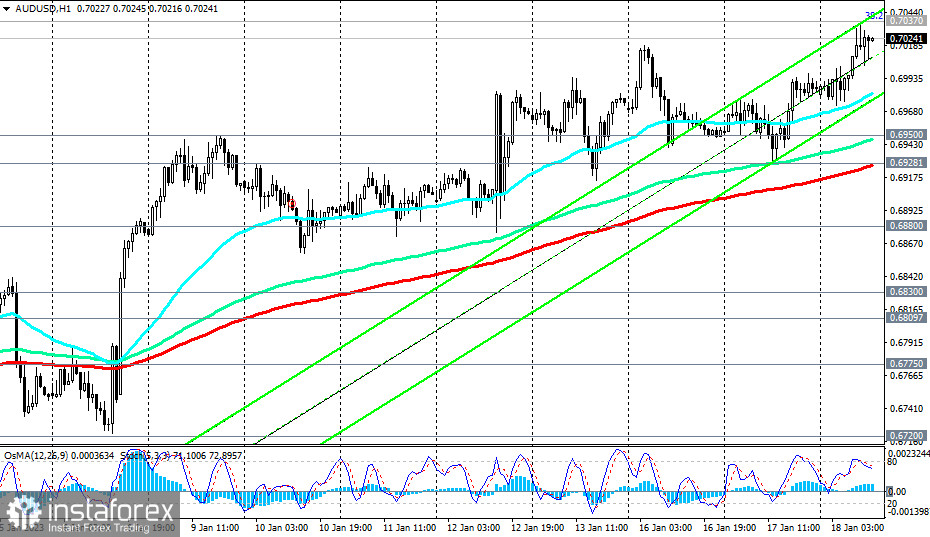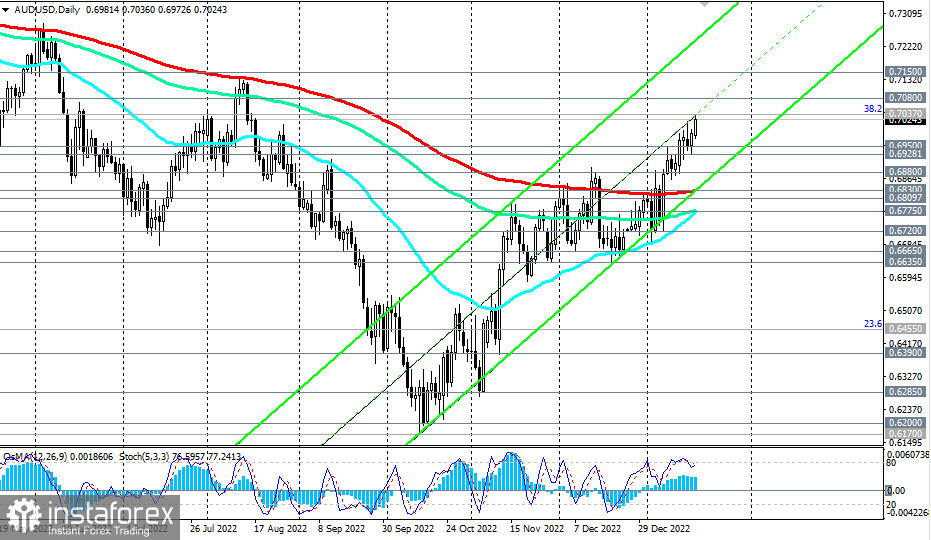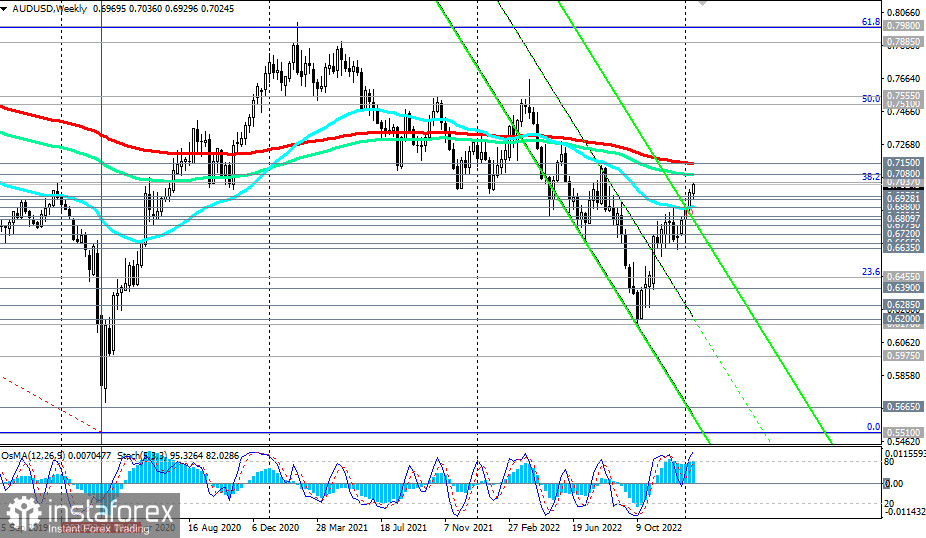
Against the backdrop of positive news from Australia and China and the weak U.S. dollar, the AUD/USD pair continues to develop upward dynamics in the form of a correction within a larger and global downward trend.
At the beginning of today's European trading session, the pair reached a new 5-month high at 0.7036, strengthening towards long-term resistance levels 0.7080 (144 EMA on the weekly chart), 0.7100, 0.7150 (200 EMA on the weekly chart and 50 EMA on the monthly chart). The pair may be able to reach these levels, but breaking them will be difficult, given the general long-term downward trend (from a technical point of view).

Alternatively, the first signal for resuming sales of the pair may be a breakdown of today's low at 0.6973 and support levels 0.6950, 0.6928 (200 EMA on the 1-hour chart).
The nearest target of the decline is the 0.6830 support level (the lower line of the rising channel and 200 EMA on the daily chart), then the marks and support levels 0.6800, 0.6775 (144 EMA and 50 EMA on the daily chart), 0.6720 and return to the descending channel on the weekly chart with the lower boundary passing through 0.5665.

Support levels: 0.7000, 0.6950, 0.6928, 0.6900, 0.6880, 0.6830, 0.6800, 0.6775, 0.6720, 0.6700, 0.6665, 0.6635
Resistance levels: 0.7037, 0.7080, 0.7150
Trading scenarios
Sell Stop 0.6970. Stop-Loss 0.7050. Take-Profit 0.6950, 0.6928, 0.6900, 0.6880, 0.6830, 0.6800, 0.6775, 0.6720, 0.6700, 0.6665, 0.6635
Buy Stop 0.7050. Stop-Loss 0.6970. Take-Profit 0.7080, 0.7150


