


Analyzing Wednesday's trades:
EUR/USD on 30M chart
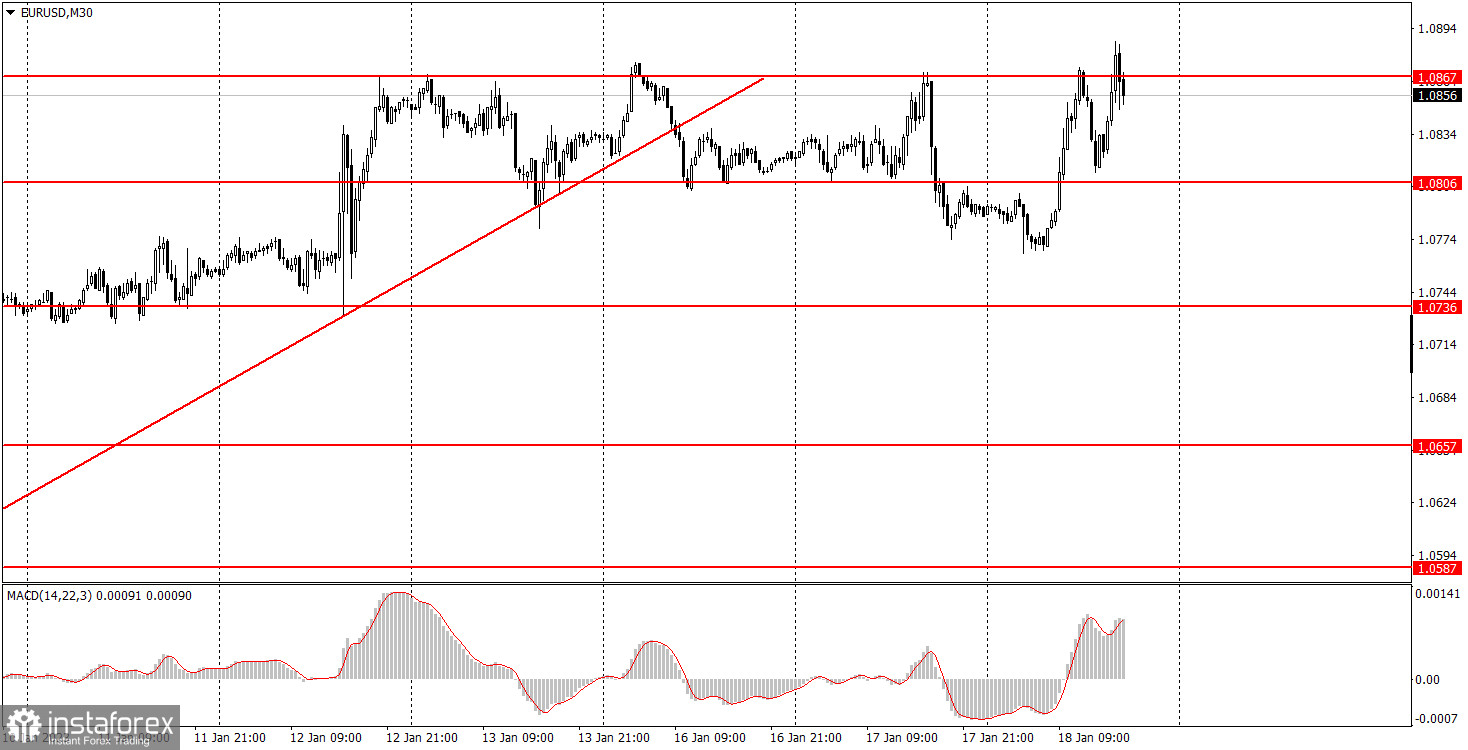
EUR/USD maintained its uptrend and once again reached 1.0867, which is still keeping the euro from reaching new heights. The euro's growth is unreasonable since there were no important events on Wednesday, nonetheless the euro started to grow in the morning. The only report at the European session was the inflation rate of the second estimate, which turned out to be the same as the first one. Nevertheless, the pair showed volatility of about 120 pips during the day. Partly, the upward movement might have been triggered by the U.S. data, as the industrial production and retail sales were even worse than projections. Also, the Federal Reserve's monetary committee was due to make several speeches during the day, and the market only considers their rhetoric in terms of hints on a possible slowdown in the rate hikes. If the market receives such hints, it is happy to sell the dollar and buy the euro again. Therefore, I don't think we'll see a correction even when the pair crosses the ascending trend line.
EUR/USD on M5 chart
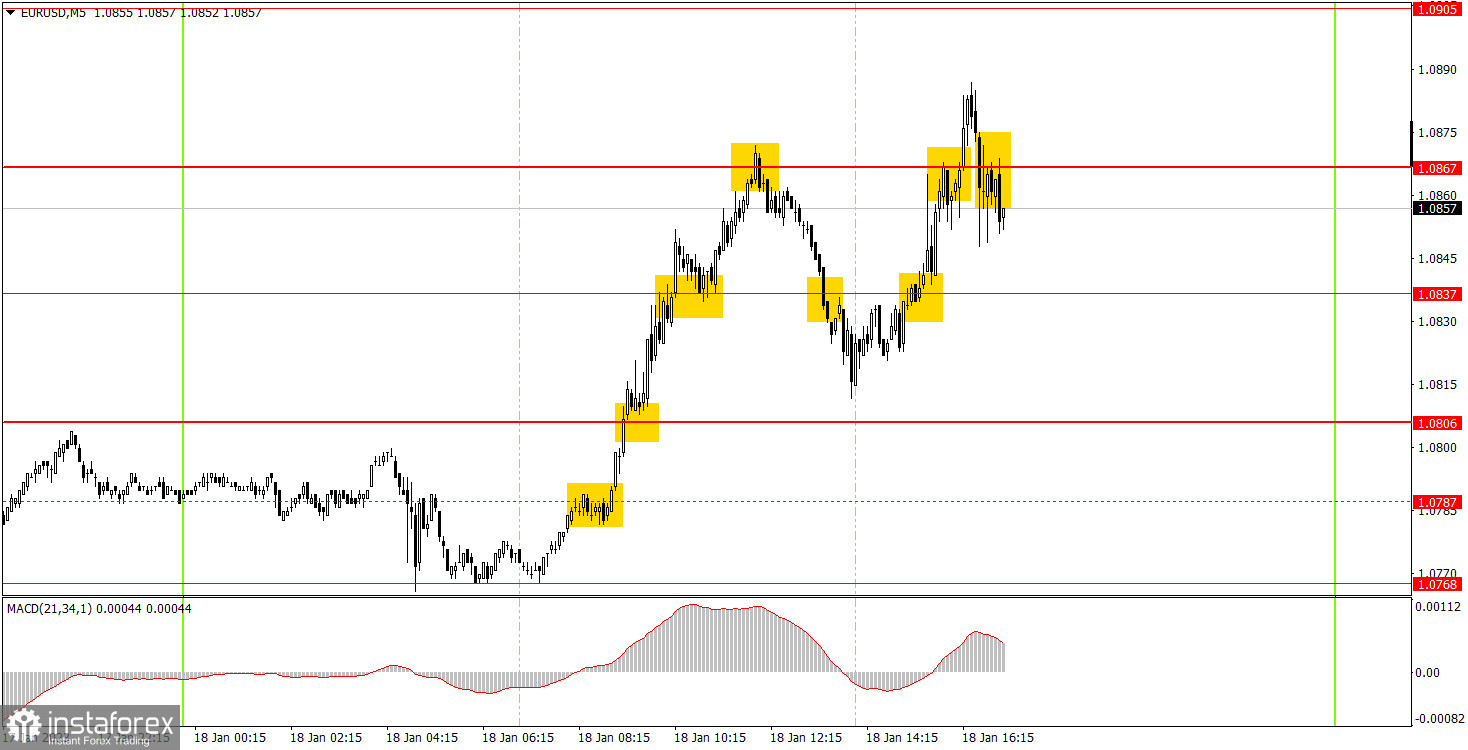
Plenty of trading signals on Wednesday. The first signal near 1.0787, which was considered as irrelevant by the day's results, provoked growth to 1.0867. Naturally, it was necessary to work it off, and the deal brought around 50 pips of profit. The sell signal at 1.0867 should have been executed (short position), but the price went down below 1.0837, and did not reach the next target too. Therefore, shorts should have been closed at the next buy signal, which was formed near 1.0837. The shorts gained about 10 pips. The buy signal could have been executed, but the price reversed sharply downwards again at the end of the day, and after climbing above 1.0867, it fell. That's why the profit of the last deal was about 10 points. On the whole, it was possible to earn no less than 70 pips, which is an excellent result.
Trading tips on Thursday:
The pair maintains an uptrend on the 30-minute chart, despite crossing the trend line. As we can see, neither four bounces from 1.0867, nor the fact that it crossed 1.0806 can change the market sentiment into a bearish one. Therefore, each new consolidation or rebound from these levels can be regarded as sell signals, but we should be very careful. On the 5-minute chart, it is recommended to trade at the levels 1.0657-1.0668, 1.0697, 1.0736, 1.0768, 1.0806, 1.0837, 1.0905, 1.0923-1.0933, 1.0966, 1.0989. As soon as the price passes 15 pips in the right direction, you should set a Stop Loss to breakeven. On Thursday, speeches by Christine Lagarde, Isabelle Schnabel (ECB) and several leaders are scheduled in the European Union. There will be no important reports. However, volatility might be high again, as speeches from ECB and Fed officials are always likely to trigger movements.
Basic rules of the trading system:
1) The strength of the signal is determined by the time it took the signal to form (a rebound or a breakout of the level). The quicker it is formed, the stronger the signal is.
2) If two or more positions were opened near a certain level based on a false signal (which did not trigger a Take Profit or test the nearest target level), then all subsequent signals at this level should be ignored.
3) When trading flat, a pair can form multiple false signals or not form them at all. In any case, it is better to stop trading at the first sign of a flat movement.
4) Trades should be opened in the period between the start of the European session and the middle of the US trading hours when all positions must be closed manually.
5) You can trade using signals from the MACD indicator on the 30-minute time frame only amid strong volatility and a clear trend that should be confirmed by a trendline or a trend channel.
6) If two levels are located too close to each other (from 5 to 15 pips), they should be considered support and resistance levels.
On the chart:
Support and Resistance levels are the levels that serve as targets when buying or selling the pair. You can place Take Profit near these levels.
Red lines are channels or trend lines that display the current trend and show in which direction it is better to trade now.
The MACD indicator (14, 22, and 3) consists of a histogram and a signal line. When they cross, this is a signal to enter the market. It is recommended to use this indicator in combination with trend patterns (channels and trendlines).
Important announcements and economic reports that can be found on the economic calendar can seriously influence the trajectory of a currency pair. Therefore, at the time of their release, we recommend trading as carefully as possible or exiting the market in order to avoid sharp price fluctuations.
Beginners on Forex should remember that not every single trade has to be profitable. The development of a clear strategy and money management is the key to success in trading over a long period of time.


