Long positions on GBP/USD:
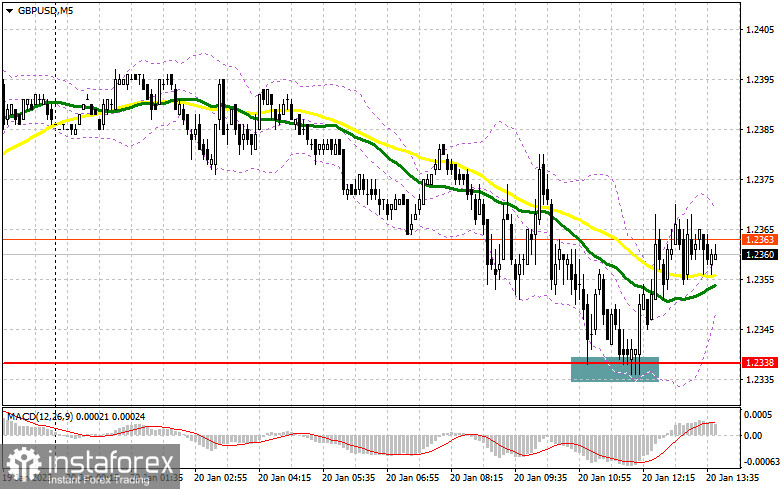
In the morning, there was only one signal to enter the market. Let's have a look at the 5-minute chart and analyze the situation there. The GBP/USD pair declined and formed a false breakout near 1.2338. This created a good buy signal, which is still active at the moment. In total, the British pound soared by about 30 pips but has not yet reached the target of 1.2431. In the afternoon, the technical picture has not changed as well as the trading plan.

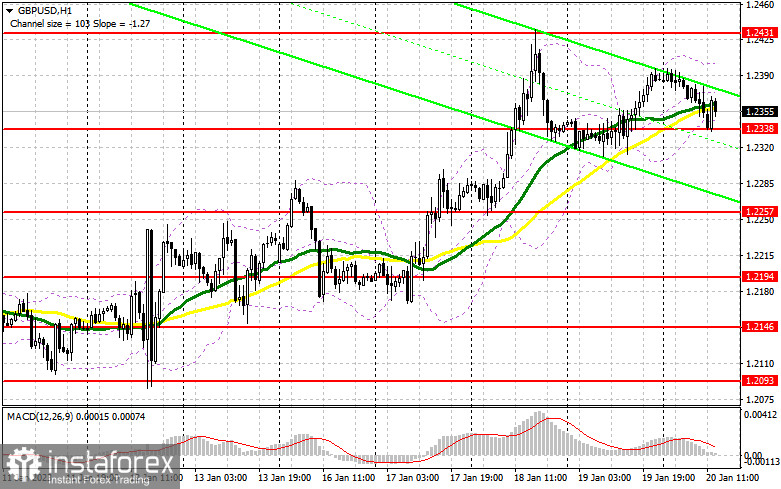
If the British pound declines again, only a false breakout near the support at 1.2338 may allow the price to build a powerful bullish momentum and return to the monthly high of 1.2431. Weak fundamental US data - existing home sales - may help with that. if the price settles above 1.2431 after the dovish rhetoric of Fed representatives, GBP may rise to the high of 1.2499. Breaking through above this level along with its downward test may push the pair to 1.2553, where traders may lock in profits. If bulls fail and let the price fall below 1.2338, the pressure on the GBP/USD pair is likely to increase at the end of the week, which will lead to a downward correction. For this reason, it would be better to postpone opening long positions. You may open long positions on a decline and a false breakout near the low of 1.2257. You may also buy the British currency on a rebound from 1.2194, allowing an intraday correction of 30-35 pips.
Short positions on GBP/USD:
Bears tried to push the pair down but they did not succeed. They should take control over the level of 1.2338 and the monthly high. If the pair surges on weak US data, only a false breakout at 1.2431 may give a signal to open short positions, allowing the pair to return to 1.2338, where the MAs support bulls. A breakthrough and a reverse bottom-top test of this level may cancel the bullish prospects and create a sell signal with the target at 1.2257. The next target is located in the area of 1.2194, where traders may take profits. If the GBP/USD pair grows and bears show weak activity at 1.2431 in the second half of the day, the development of a new bullish trend is likely to continue. In that case, only a false breakout near the high of 1.2499 may give an entry point into short positions. In case there is no activity there, it would be better to sell the British pound from the high of 1.2553, counting on a downward intraday bounce by 30-35 pips.


Signals of indicators:
Moving averages
The pair is trading near the 30- and 50-day moving averages, indicating market uncertainty.
Note: Period and prices of moving averages are considered by the author on hourly chart H1 and differ from the common definition of classic daily moving averages on daily chart D1.
Bollinger Bands
If the pair grows, the upper band of the indicator near 1.2405 will offer resistance.
Description of indicators
- Moving average defines the current trend by smoothing out volatility and noise. Period 50. Marked in yellow on the chart.
- Moving average defines the current trend by smoothing out volatility and noise. Period 30. Marked in green on the chart.
- MACD (Moving Average Convergence/Divergence) indicator. Fast EMA 12. Slow EMA 26. SMA 9
- Bollinger Bands. Period 20
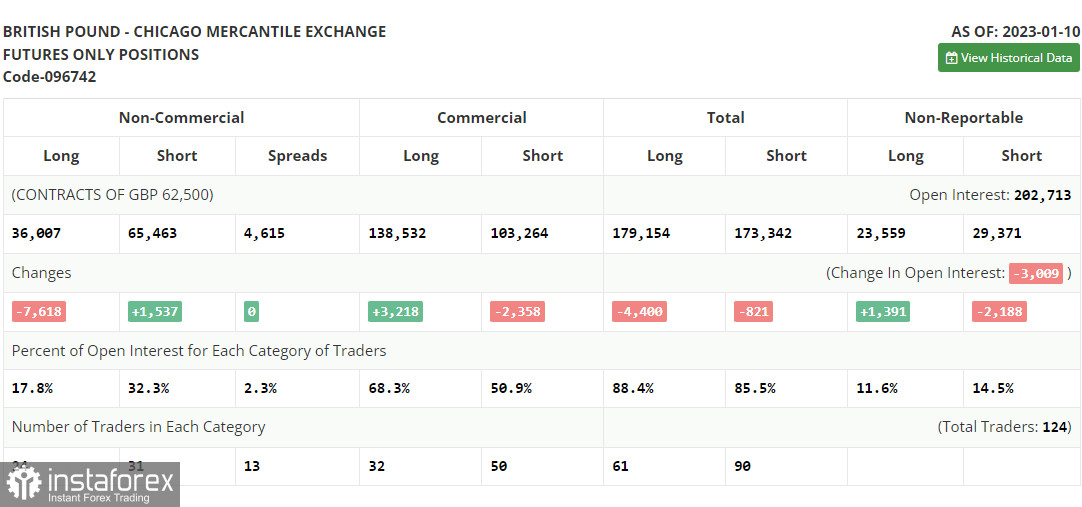
- Non-commercial traders are speculators, such as individual traders, hedge funds and large institutions, which use the futures market for speculative purposes and meet certain requirements.
- Long non-commercial positions represent the total long open position of non-commercial traders.
- Short non-commercial positions represent the total short open position of noncommercial traders.
- Total non-commercial net position is the difference between short and long positions of non-commercial traders.


