


On the daily chart, the price is close to the upper limit of the downtrend price channel of green color (130.70).
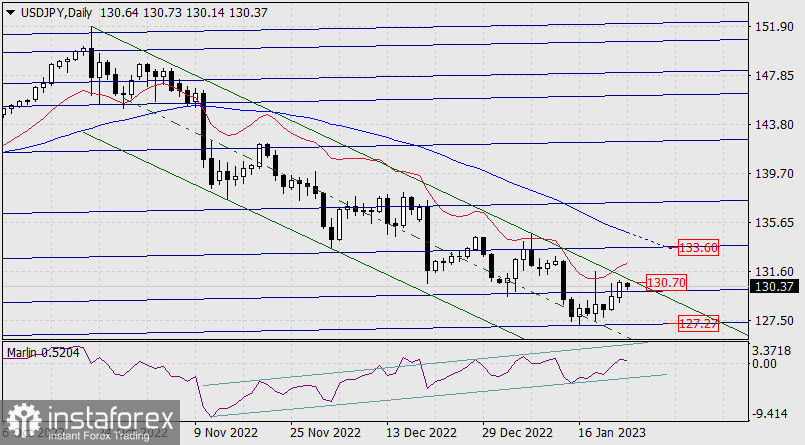
The Marlin oscillator is in the positive territory, so the main scenario assumes that the price overcomes this resistance and an attempt to further growth to the upper line of the price channel of blue color in the area of its intersection with the MACD line, near the 133.60 mark.
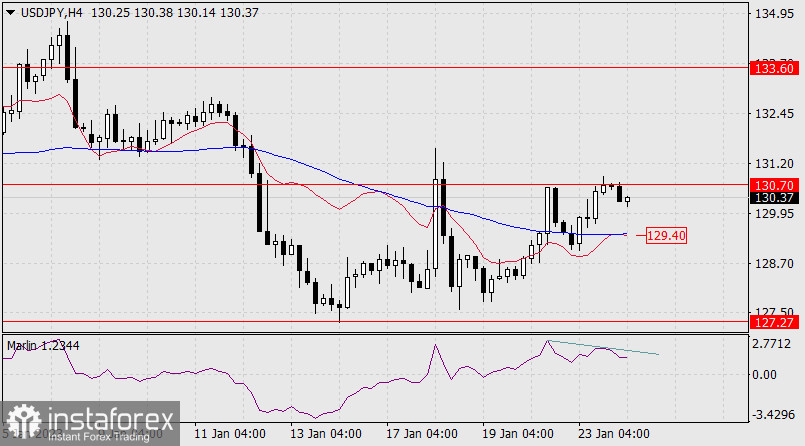
There is a small divergence on the four-hour chart. If the reversal develops, i.e. if it overcomes the support of the MACD line (129.40), then the signal line of the oscillator may return to negative territory. Further, falling to the lower line of the global price channel, to the area of 127.27 (daily) is likely.


