


EUR/USD
Higher time frames
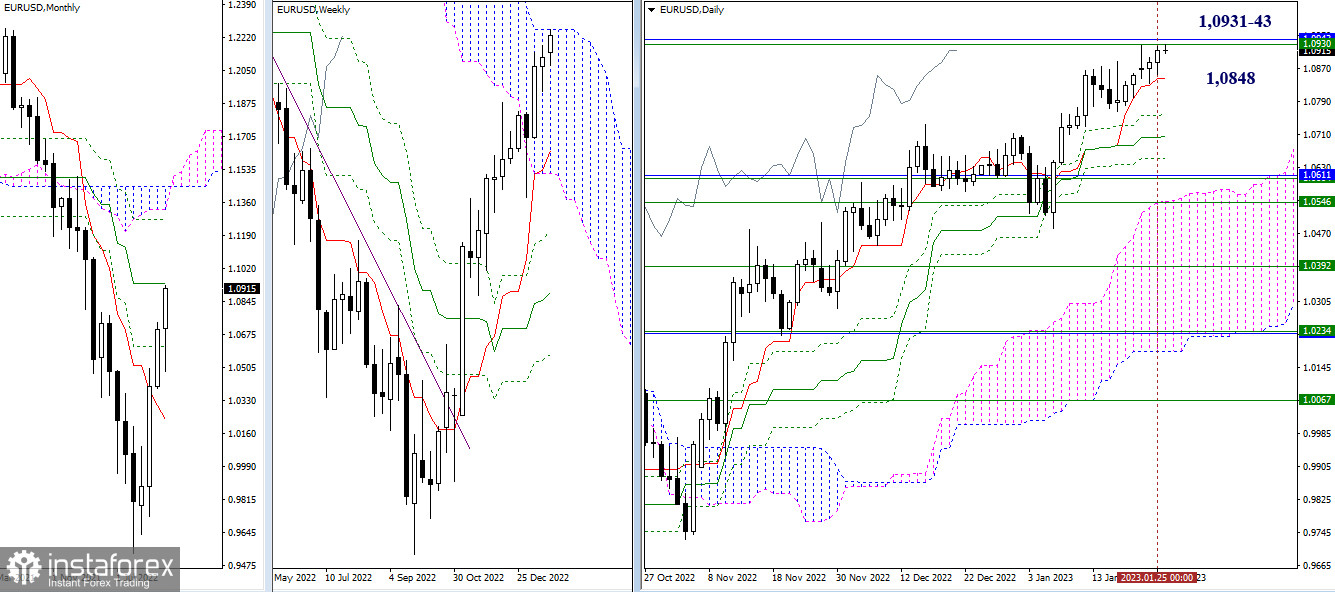
The bulls are on the way to breaking through the 1.0931-43 resistance range, which is represented by the upper limit of a one-week cloud and a one-month medium-term trend line. In case the price breaks through the barrier, we may see a bullish continuation. If the quote pulls back and heads toward support, targets will stand at the levels of the daily Ichimoku cross (1.0848 – 1.0757 – 1.0705 – 1.0653).
H4 – H1
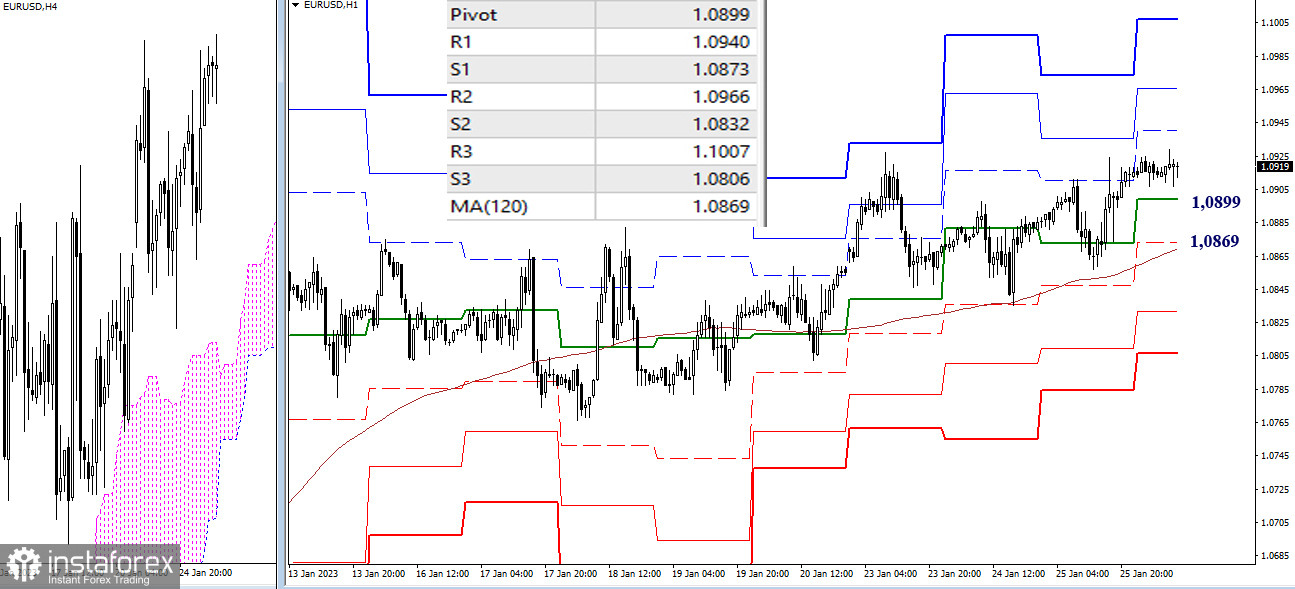
Lower time frames illustrate bullish sentiment in the market. Upward intraday targets are seen at classic pivot resistance levels of 1.0940 – 1.0966 – 1.1007. Key levels of lower time frames serve as support today. They will also limit the corrective move. If the quote tests the key levels of 1.0899 (central pivot level) and 1.0869 (one-week long-term trend line), it may disrupt the equilibrium, changing market sentiment to bearish.
***
GBP/USD
Higher time frames
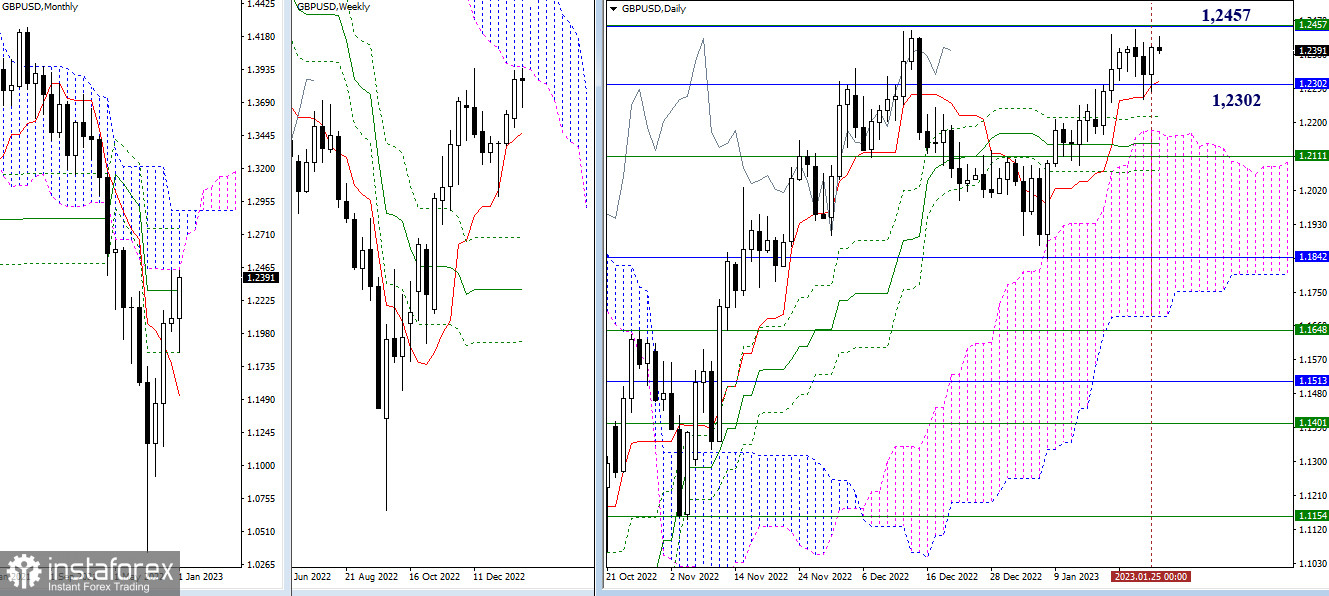
Yesterday, the price rebounded from support at 1.2302 (intraday short-term trend line + one-month medium-term trend line) in the daily time frame. As a result, the pair returned to resistance at 1.2457 (upper limits of the Ichimoku cloud of one-month and one-week time frames). The price is still moving in the 1.2302-1.2457 range. The previous outlook is still intact.
H4 – H1
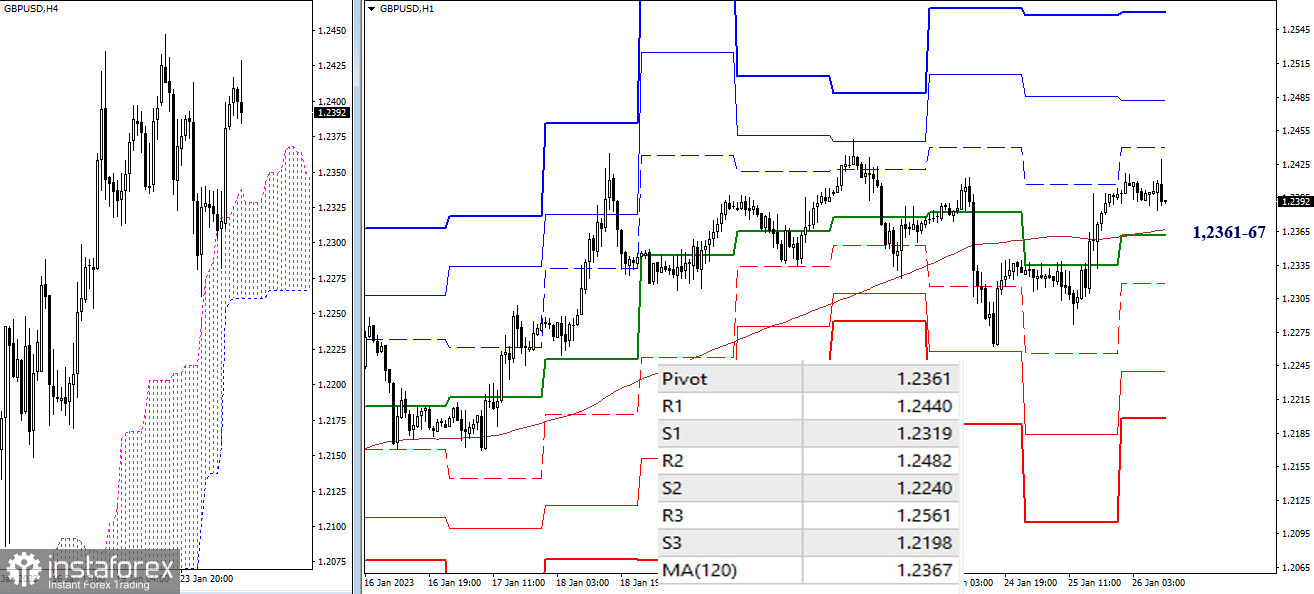
Recently, the key levels of the lower time frames have been almost horizontal with the pair hovering around them. The fact that the quote is swinging between one level or the other indicates uncertainty in the market. Currently, the pair is bullish. Upward targets are seen at 1.2440 – 1.2482 – 1.2561 (classic pivot levels). Consolidation below the 1.2361-67 range (central pivot level + one-week long-term trend line) may cause an increase in bearish sentiment. Downward targets stand at classic pivot support levels of 1.2319 – 1.2240 – 1.2198.
***
Indicators used in technical analysis:
Higher time frames - Ichimoku Kinko Hyo (9.26.52) + Fibo Kijun levels
H1 – classic pivot points + 120-period Moving Average (weekly long-term trendline)


